More On: btc
Bitcoin mining hash rate increases by 60% despite falling revenue per terra hash
BTC research: Bitcoin's realized price indicates that a bottom may be forming
Bitcoin sell-off causes $20 million in long positions to be liquidated
Daily Crypto Wrapped: BTC short liquidations exceed $9 million, and Ava Labs CEO calls CryptoLeaks allegations a 'conspiracy theory'
Ethereum (ETH) hits $2000 as Merge nears
During the last week, Bitcoin investors made the largest loss in history by selling their coins. According to BeInCrypto's analysis of on-chain indicators, the last 6 days resulted in a loss of $19.121 billion in Bitcoin.
- The Realized Loss has reached ATH as a result of the sharp decline in the price of BTC.
- Bitcoin investors have suffered a $19.121 billion loss in the last six days.
- In the meantime, the Net Realized Profit/Loss ratio is at an all-time low.
The avalanche of selling was triggered by the loss of support in the $28,000 area on June 12th (blue arrow). A day later, a large red candle with a body of more than -15 percent was printed.
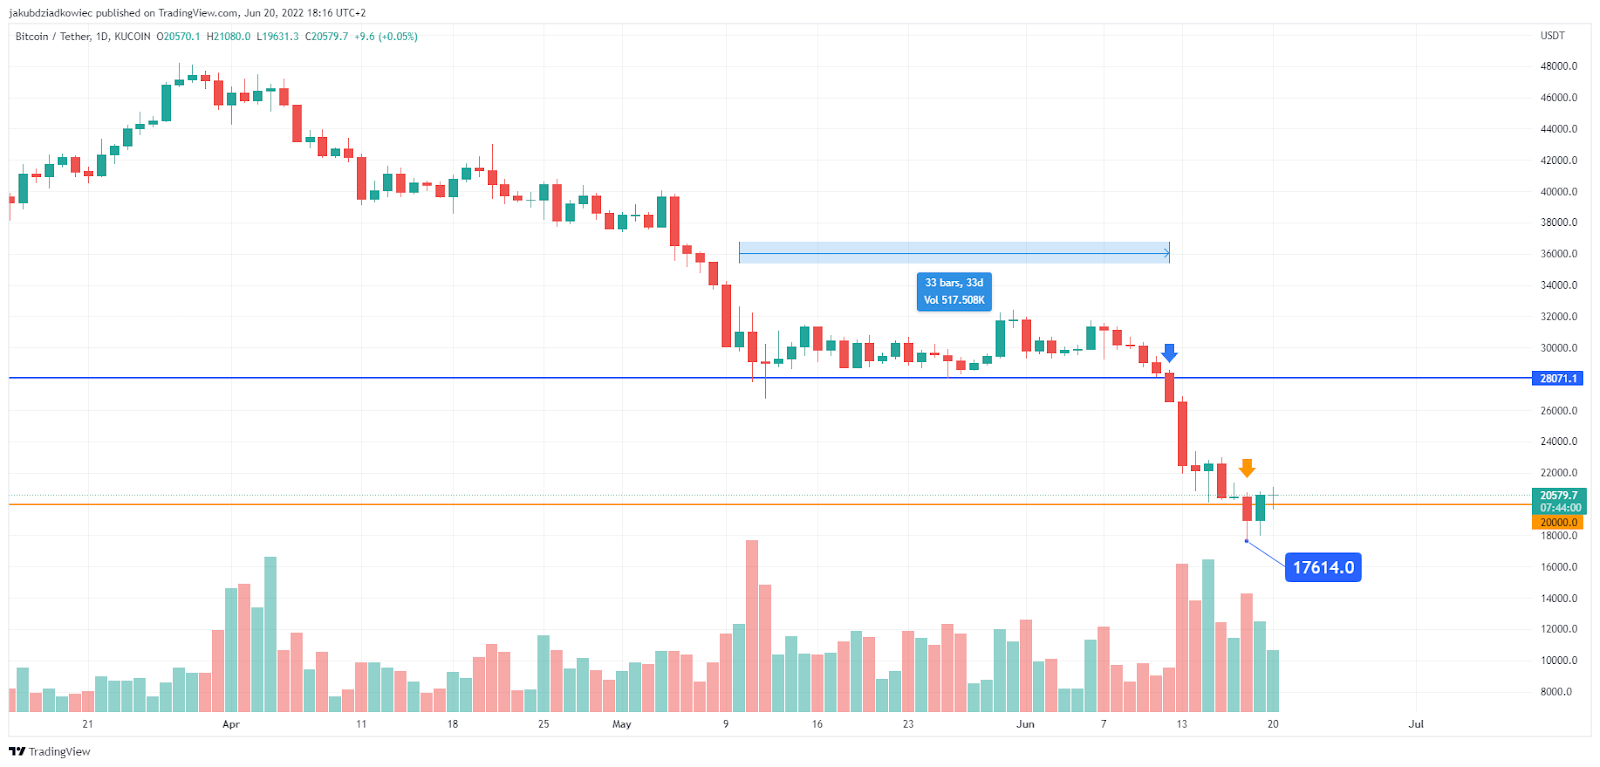
On June 18, Bitcoin fell below the previous 2016-2017 cycle peak of $20,000 in an unprecedented drop (orange arrow).
These dynamic downward movements occurred at a high volume. This indicates that a large number of coins have changed hands in this range. Furthermore, the move occurred following a 33-day consolidation in the $28,000-$32,000 range. This area will most likely now serve as resistance.
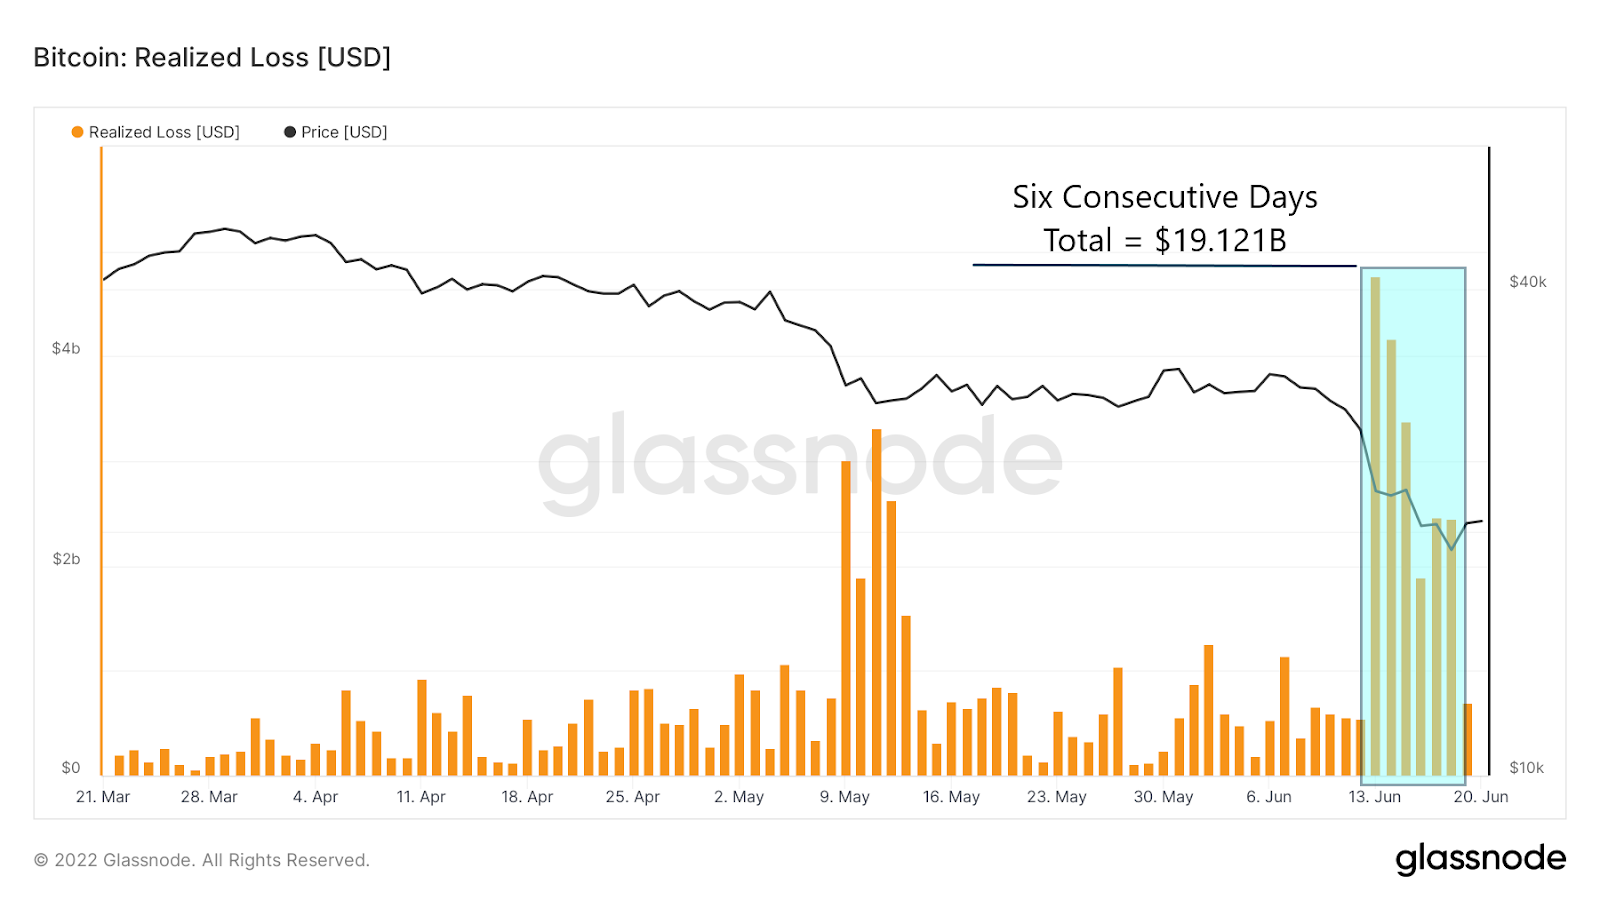
Realized Loss has reached a new high.
The Realized Loss indicator represents the total loss (in USD) of all moved coins whose price at the previous move was greater than the price at the current move.
The above-mentioned price action from June 13 to 18 pushed the realized loss ratio to an all-time high. For the last six days, investors suffered a total loss of $19.121 billion when they decided to sell coins purchased at higher prices (blue area).
These are dollar-for-dollar losses that Bitcoin investors and traders have never seen before. This is clearly visible on the long-term chart, where the realized loss is represented by the 7-day moving average.
Only a month ago, USA GAG examined the same on-chain indicator, implying that the Realized Loss in May may have indicated an impending bottom in the Bitcoin price (green circle). This was due to a significant increase in Realized Loss during BTC's decline from $38,000 to $29,000. At that point, the indicator was approaching its previous high, which had been set during a similar decline in May 2021. (blue circle).
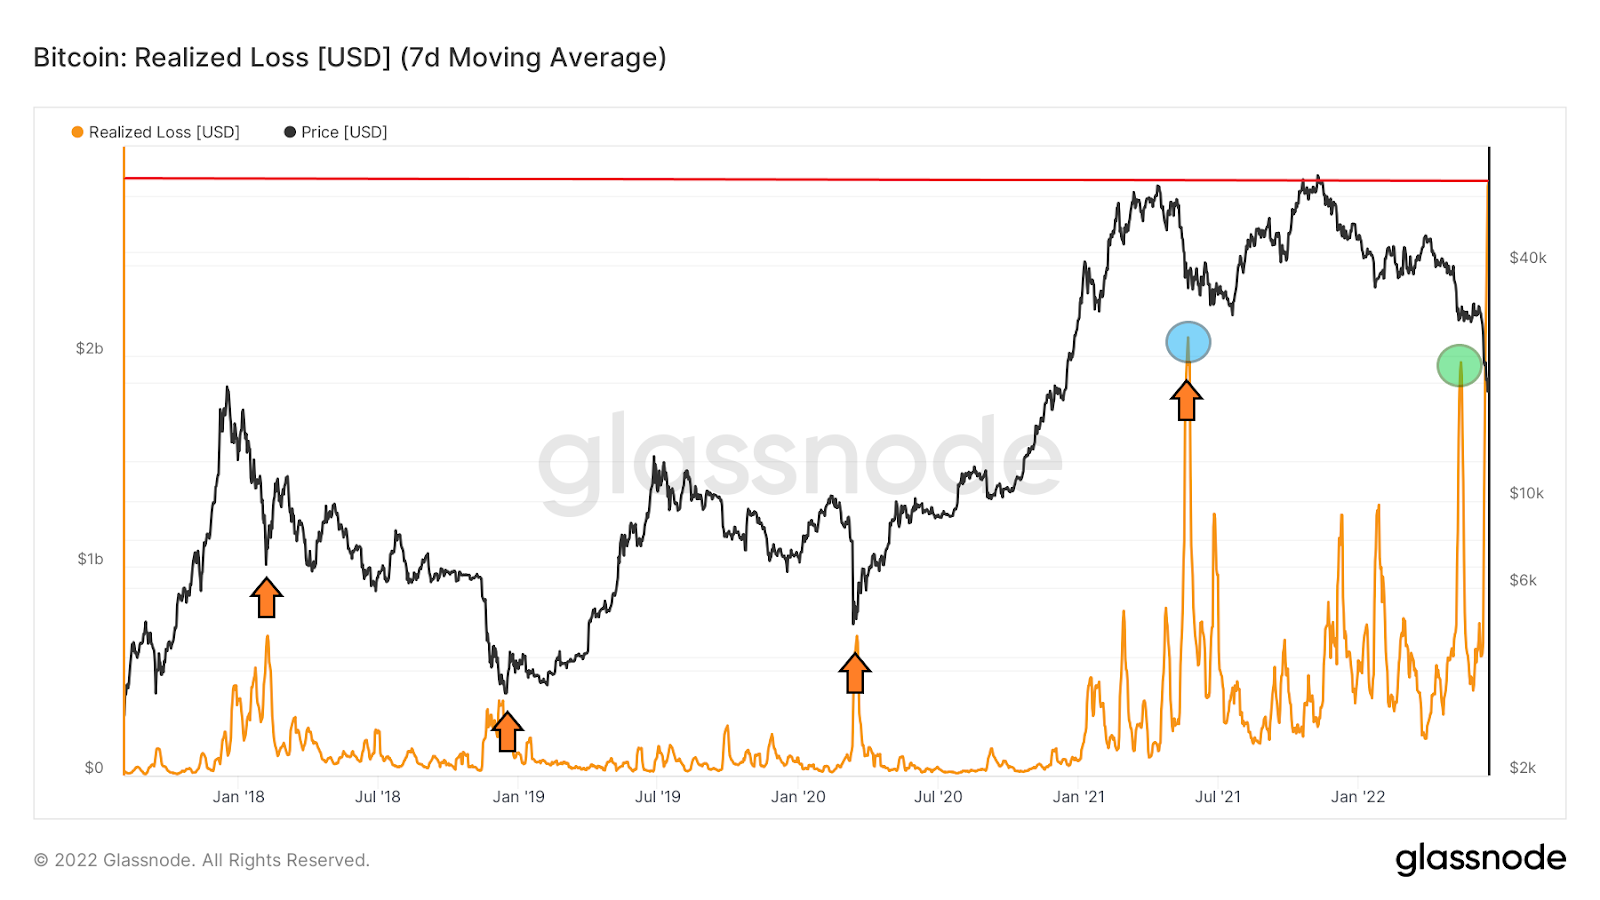
However, the realized loss we are witnessing today is significantly higher than all previous investor loss peaks (red line). The indicator's 7-day moving average is now at an all-time high of $2.831 billion.
At the same time, keep in mind that historically, extreme high Realized Loss readings were indicators of a local or macro bottom (orange arrows). As a result, they were frequently followed by strong bounces.
We've already lost more Bitcoin.
A different perspective on the Realized Loss indicator is provided by expressing its size in BTC rather than USD. In this case, it turns out that there were times when investors decided to sell their assets at a higher loss relative to their current Bitcoin value.
@SwellCycle, an on-chain analyst, tweeted a chart of Realized Loss expressed in BTC dating back to 2015. On the chart, he highlighted areas (yellow) where investors suffered extremely high losses. The most severe drop, which occurred on June 13, was only the third highest realized loss in Bitcoin history.
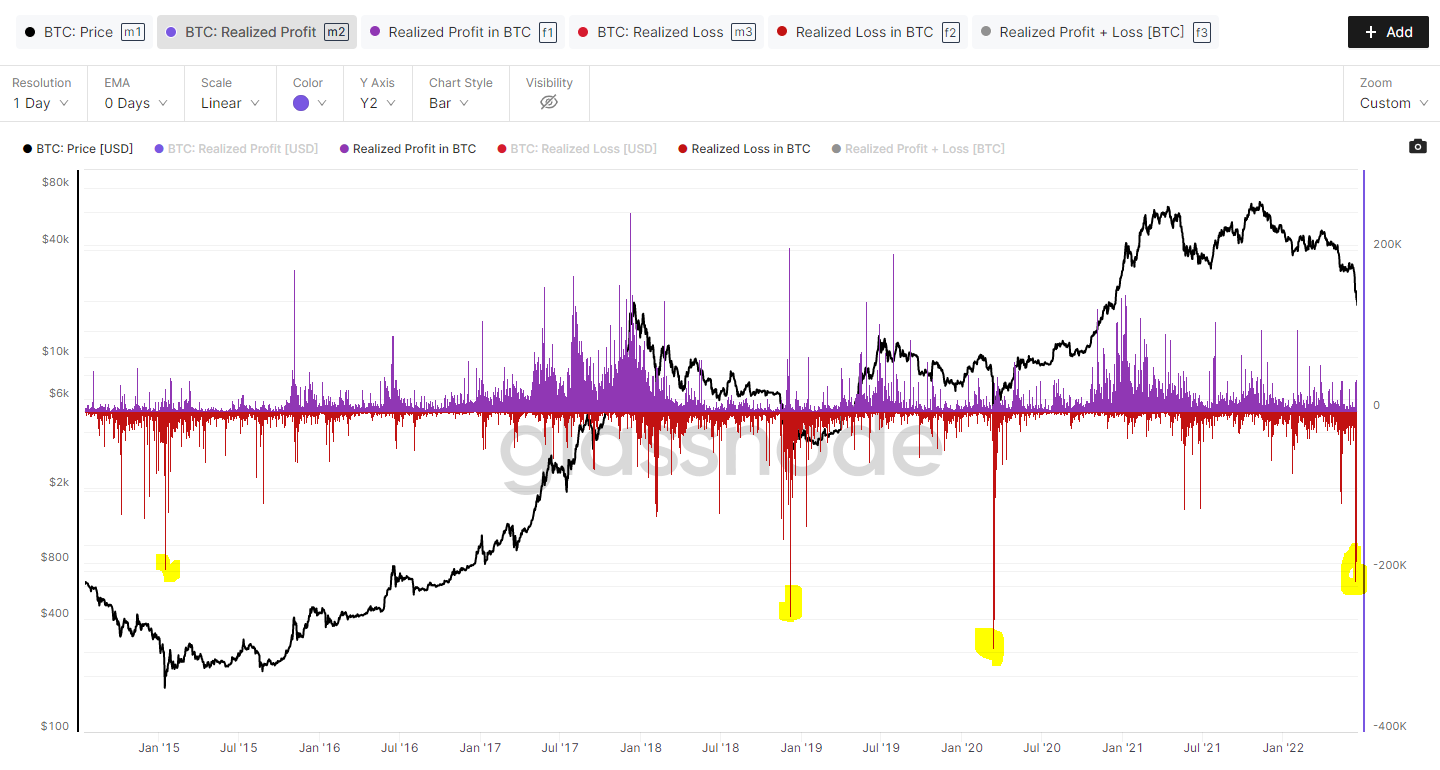
The greater the Realized Loss, the closer it was to the bottom of a previous bear market in December 2018. In contrast, the COVID-19 crash in March 2020 resulted in a massive realized loss, the largest ever measured in BTC. Furthermore, during the bear market bottom in January 2015, a realized loss comparable to current levels was reached.
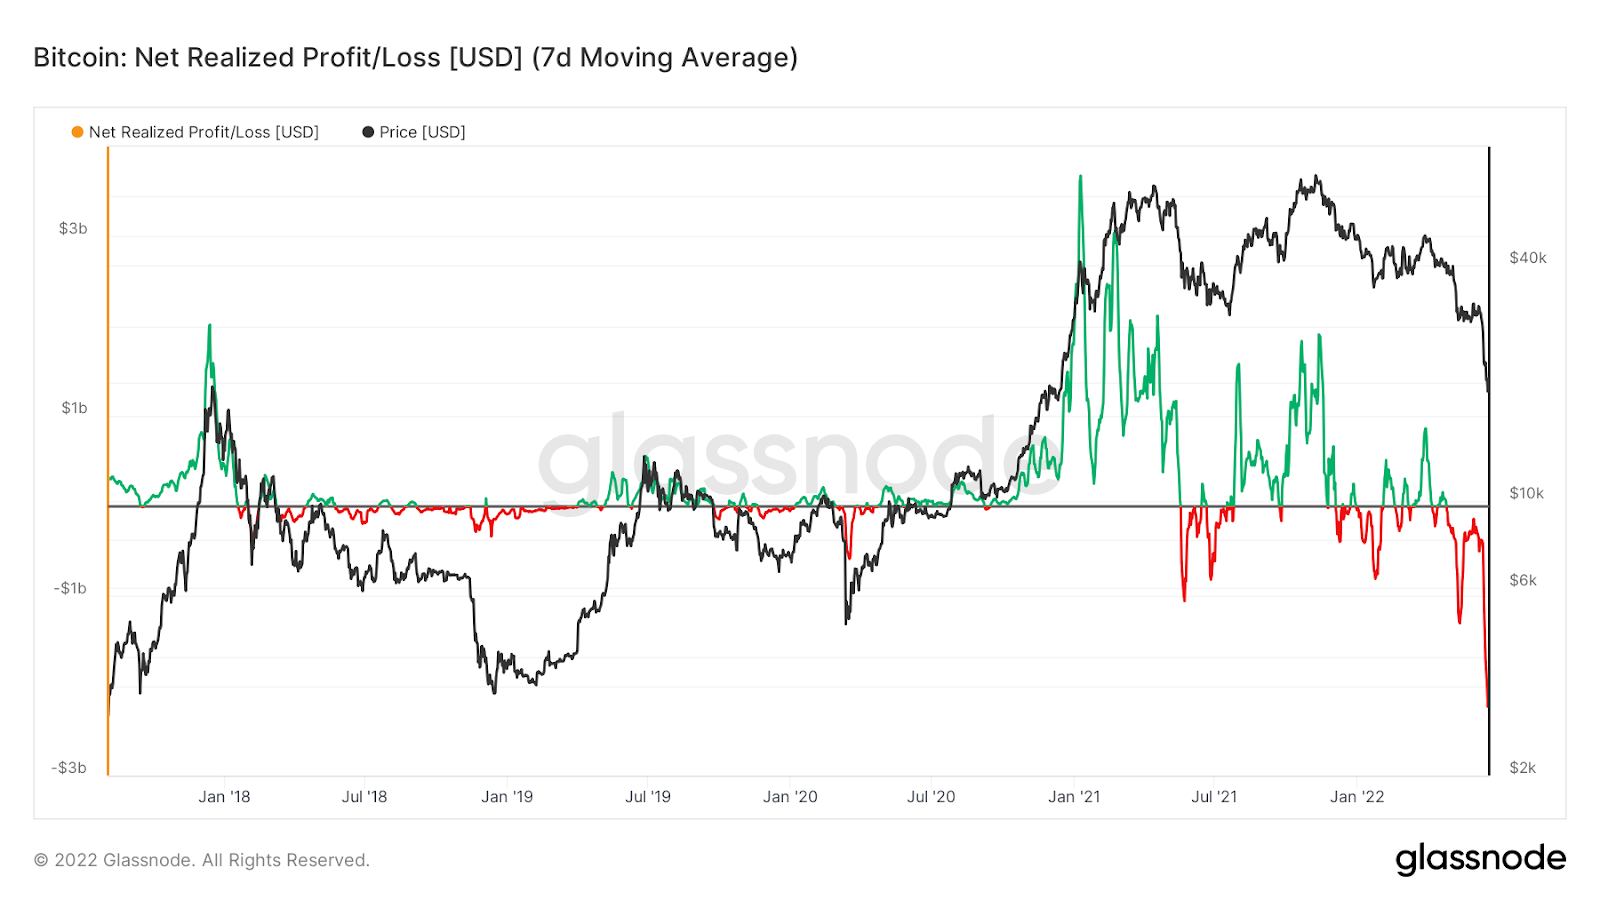
ATL is reached by Net Realized Profit/Loss.
Another indicator worth mentioning is that the Realized Loss is currently at its highest level ever. The difference between realized profit and realized loss is used to calculate the Net Realized Profit/Loss ratio of all transferred coins.
In the long run, we can see that Net Realized Profit/Loss has never been lower. The chart is currently at an all-time low (ATL) of $2.199 billion. However, keep in mind that this ratio, once again, expresses the realized loss in USD.
Bitcoin today video
** Information on these pages contains forward-looking statements that involve risks and uncertainties. Markets and instruments profiled on this page are for informational purposes only and should not in any way come across as a recommendation to buy or sell in these assets. You should do your own thorough research before making any investment decisions. All risks, losses and costs associated with investing, including total loss of principal, are your responsibility. The views and opinions expressed in this article are those of the authors and do not necessarily reflect the official policy or position of USA GAG nor its advertisers. The author will not be held responsible for information that is found at the end of links posted on this page.