More On: bitcoin
How much 6 popular cryptocurrencies lost in 2022 ?
How people who watch the market were wrong about bitcoin in 2022
Twitter Is Too Musk to Fail
Why Jim Cramer suggests purchasing bitcoin or ethereum, with one exception
El Salvador's bitcoin experiment has cost $375 million so far and lost $60 million
Bitcoin recently broke through the psychological $60k level. It has already spent a significant amount of time below the $63k mark since then
BTC was seen exchanging hands at $62.4k at the time of writing. For a variety of reasons, the near-ATH period is regarded as particularly difficult. To begin, the coin is typically tested and rejected multiple times at previous resistance levels. Second, most HODLers are usually in profit at this point, which increases the incentive to sell in retrospect.
In terms of the first factor, Bitcoin has already been rejected at $62.9k a couple of times in the recent past. The latter factor appears to be playing out as well.
The phase of cashing out
At this point, nearly 98.34 percent of coins have an unrealized gain. So, in order to determine whether or not HODLers in profit have begun to cash out, let's look at the URPD metric. Simply put, the UTXO Realised Price Distribution measures the price distribution at which the circulating supply was most recently spent.
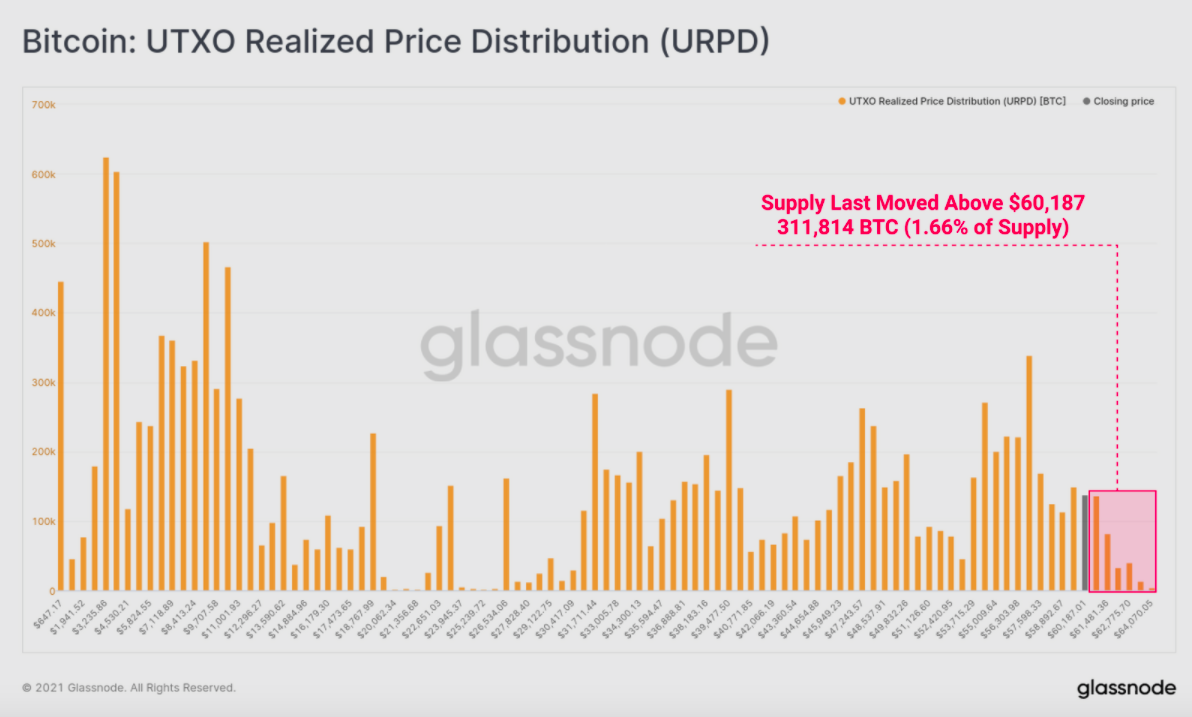
According to the chart below, around 311.8k BTC were last moved at higher prices [above $60.1k]. Notably, the owners of the aforementioned coins remained in the market during the turbulent period and exited as soon as they fetched the bare minimum.
Furthermore, the LTH net position change metric has begun to project a downward slope on its chart over the last 7 days, confirming that long-term HODLer spending has recently occurred.
Long-term HODLer spending typically coincides with the price breaking above previous highs. As a result, as BTC's price surpasses the $64k mark and trades higher, one can expect the selling to continue.
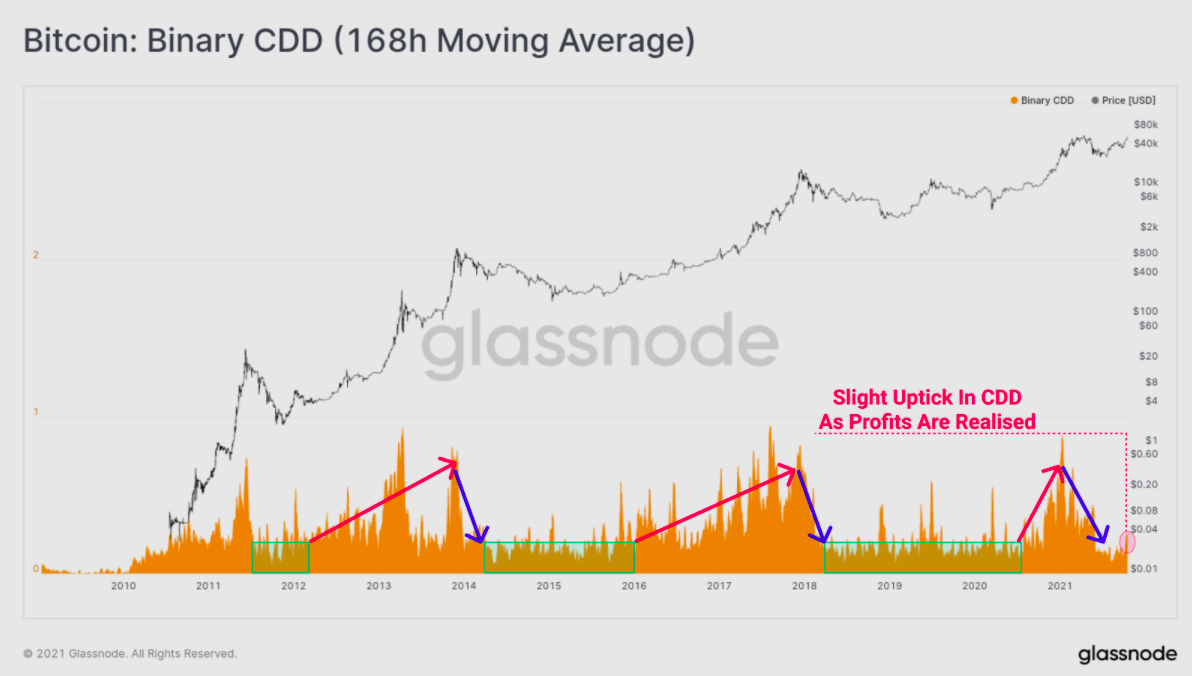
A similar trend was also revealed by the coin-days-destroyed. When this metric sees an uptick on its chart, it means that older coins are being spent in strength. A downtrend, on the other hand, denotes the slow-spending/accumulation phase.
The CDD has seen an early uptick sign in the last week, confirming that more coin days have been destroyed than the long-term average. Having said that, it should be noted that such a trend has been observed during the majority of the recent bull phases, and the market has more often than not been able to absorb the sell-pressure.
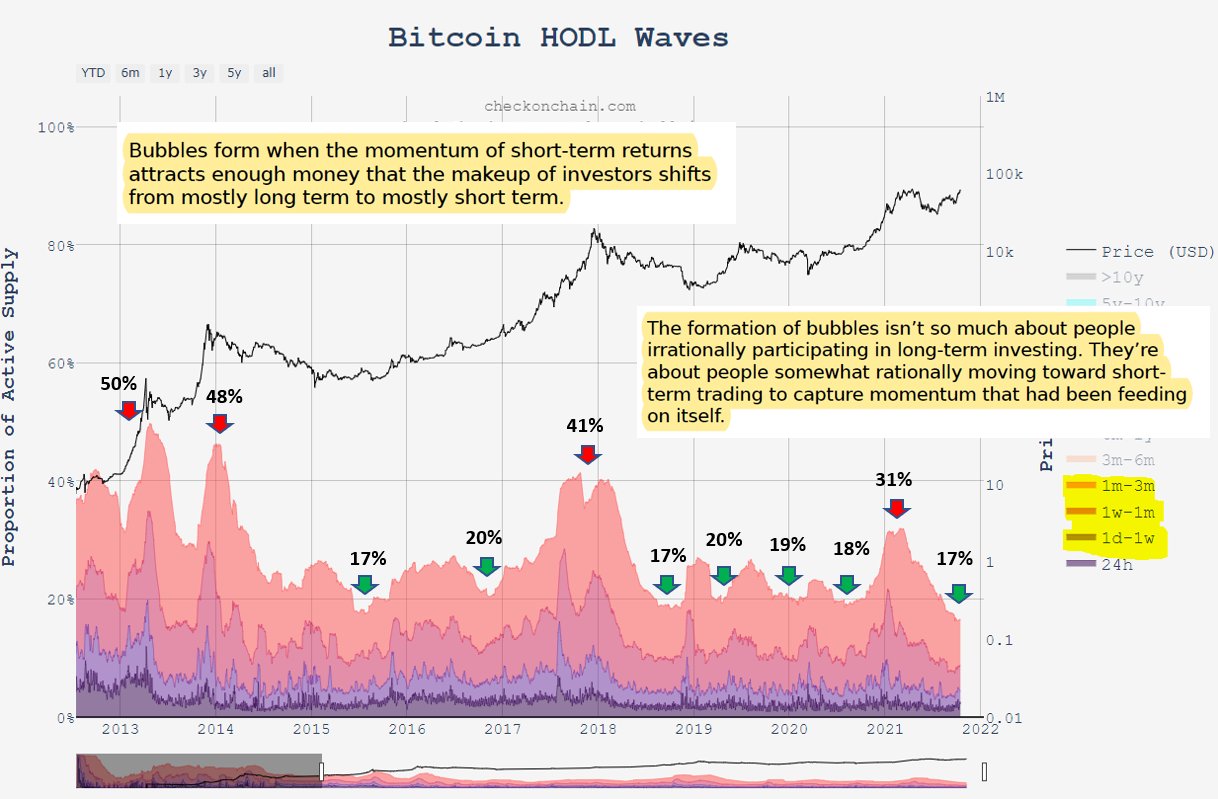
However, it should be noted at this point that the STH supply distribution has been revolving around its historical low [17 percent], implying that the market has not yet entered the "bubble" stage – which is quite healthy.
According to one of CryptoQuant's analysts, bubbles form when the momentum of short-term returns attracts sufficient money and the investor makeup shifts from long-term to short-term. People sort of voluntarily get into short-term participation during such phases in order to reap the benefits of the market's strength. In effect, the bubble tends to burst after a certain point in time.
The same thing happened during the 2013 bull run and the 2017-18 uptrend. Well, there's still plenty of time for such a scenario to play out because BTC hasn't yet reached new highs and FOMO isn't yet at its peak.
Overall, old coins being spent during an uptrend is just part of the investing process, and the outflow initiated by a specific gamut would be absorbed by the market or compensated for by new inflows in the long run.