More On: btc
Bitcoin mining hash rate increases by 60% despite falling revenue per terra hash
BTC research: Bitcoin's realized price indicates that a bottom may be forming
Bitcoin sell-off causes $20 million in long positions to be liquidated
Daily Crypto Wrapped: BTC short liquidations exceed $9 million, and Ava Labs CEO calls CryptoLeaks allegations a 'conspiracy theory'
Ethereum (ETH) hits $2000 as Merge nears
Bitcoin's price briefly fell below $20,000, and traders warn that the crucial support level may eventually crumble after a series of retests.
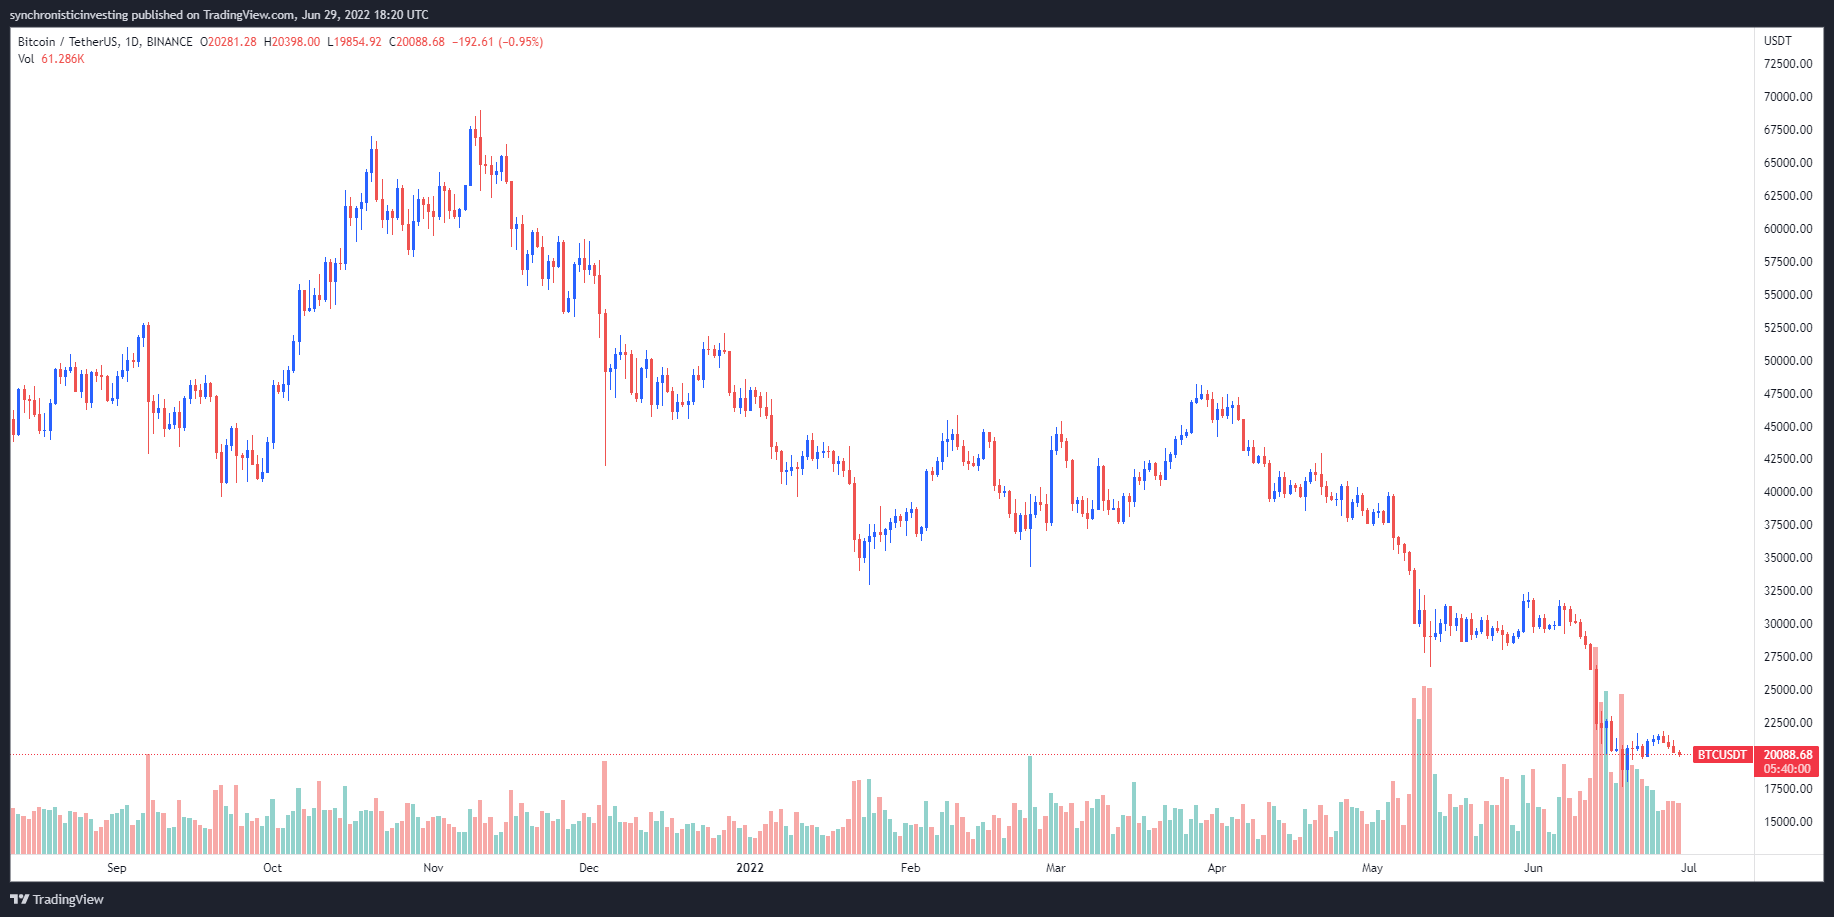
Bullish cryptocurrency traders hoping that the market was on the rise were disappointed on June 29 when the price of Bitcoin (BTC) fell below $20,000 once more during intraday trading.
According to data from Cointelegraph Markets Pro and TradingView, the top cryptocurrency was under pressure in the early hours of June 29, with bears managing to drop BTC to a daily low of $19,857 before price was bid back above the $20,000 mark.
Here's what several analysts predict will happen next for Bitcoin as it struggles to gain momentum and break out of its current price range.
Prepare for a turbulent summer.
IncomeSharks, an analyst and pseudonymous Twitter user, issued a warning to traders looking to enter the market at these levels, posting the following chart depicting one possible path that BTC could take in the months ahead.
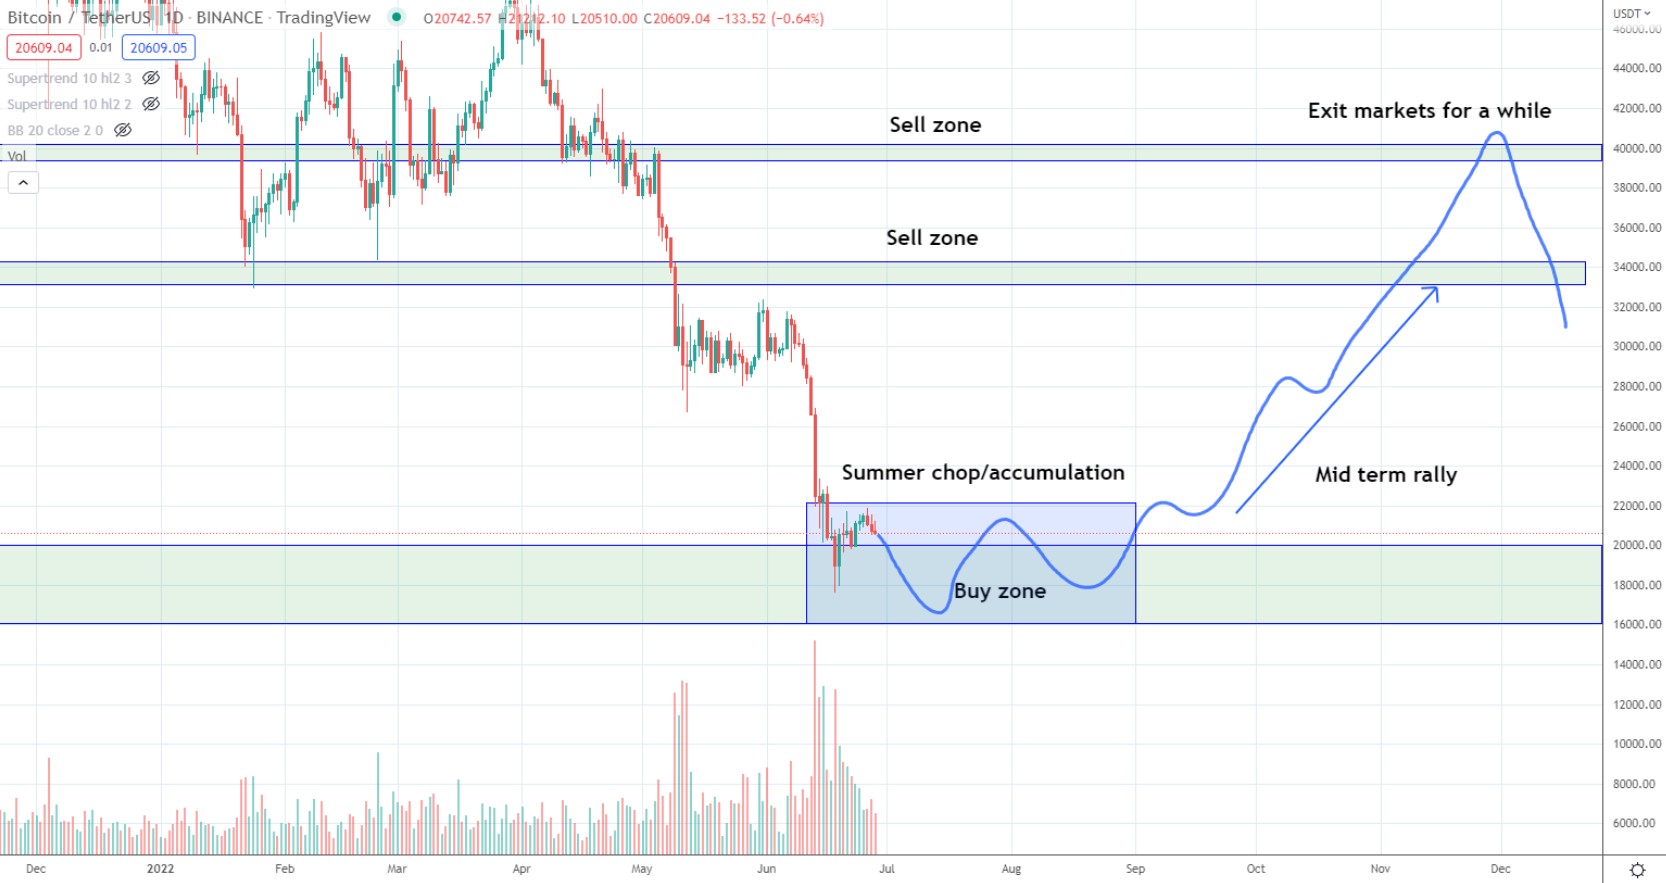
According to IncomeSharks,
“More people end up losing money in chop zones than the big drop zones. I'm bullish mid term for a lot of reasons. This summer is about swing trading and accumulation. I will derisk/sell majority end of November/December.”
Altcoin Sherpa, a Twitter user, also mentioned the possibility of a stronger pullback, posting the following chart highlighting the significance of the $20,000 level.
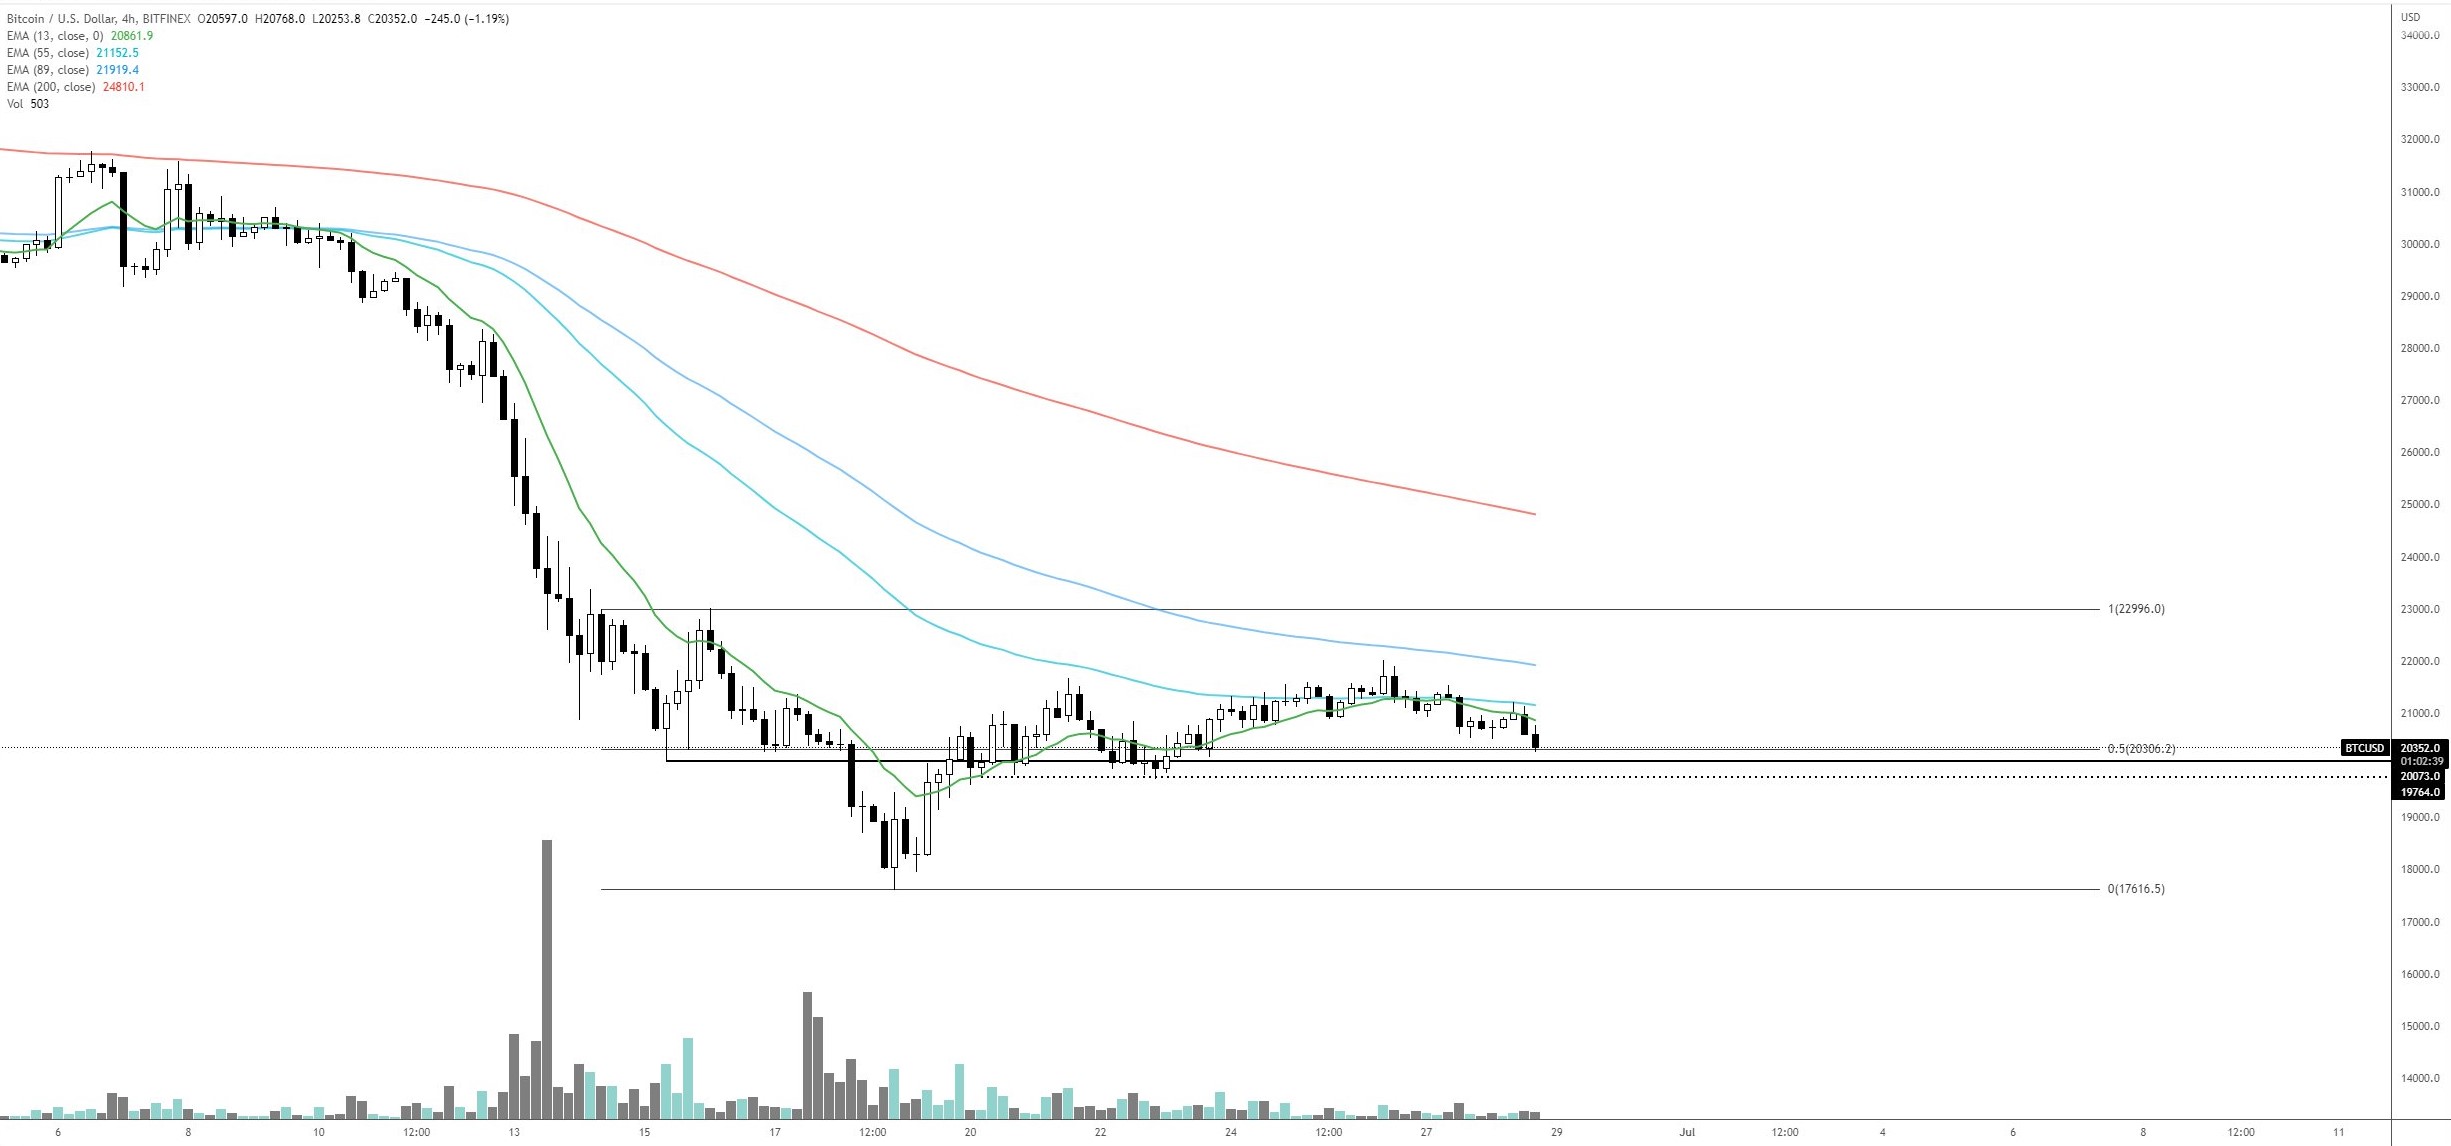
According to Altcoin Sherpa,
“Around 20K will be a pretty important area on lower timeframes; lose that and we see a move to the range lows around 17K again IMO. If this area is the bottom, I expect to see 17-18K tested again to be honest.”
Price could fall to $16,400.
According to Rekt Capital, the recent price action is similar to previous bear markets and may provide some insight into where the bottom will be.
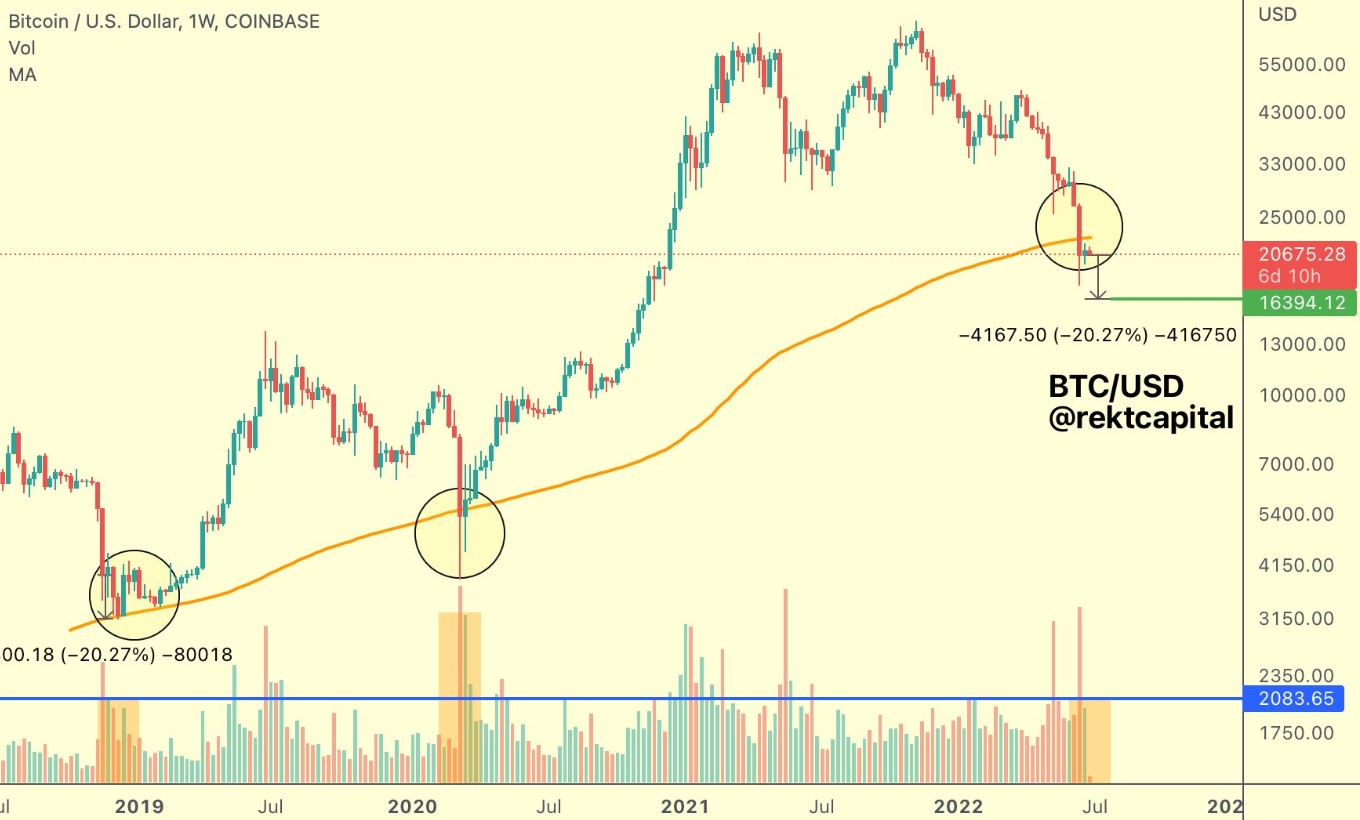
During the week of June 20, Bitcoin experienced similar buy-side volume as it did at the bottom of the 2018 bear market, near the 200-week moving average (MA).
According to Rekt Capital,
“During the formation of the 2018 bottom however, that buyer volume preceded extra -20% downside. If $BTC were to drop an extra -20% soon, price would reach ~$16,400.”
Consolidation results in accumulation.
Miles J Creative, a Twitter user, provided a more optimistic outlook, posting the chart below to support the thesis that a "bull phase is on the way."
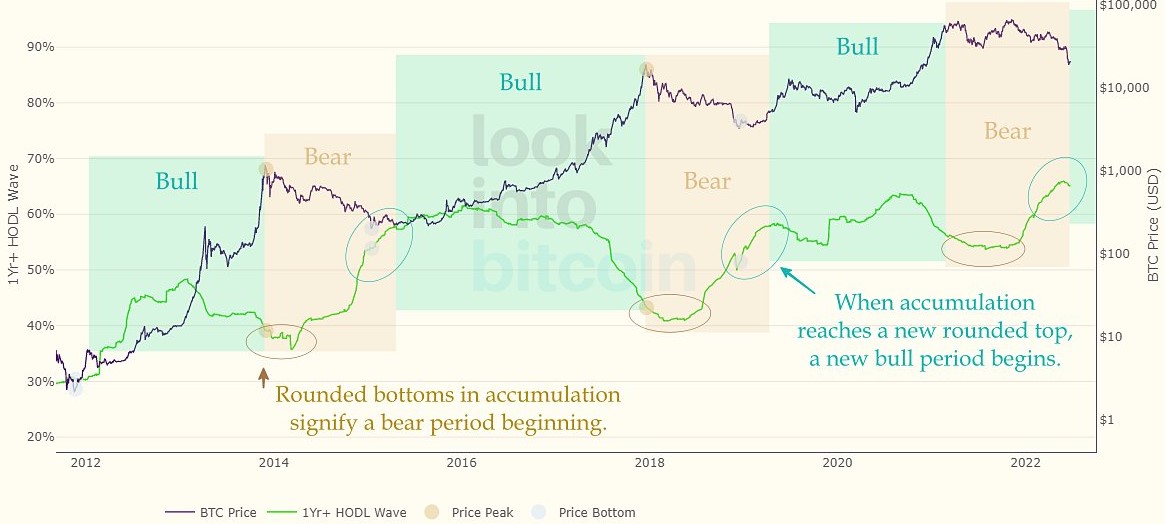
The analyst said,
“In Bitcoin's history it has only had the current accumulation structure when exiting not entering bear markets. Perhaps this time is different but accumulation is saying a bull phase is coming.”
The total cryptocurrency market cap is now $897 billion, with Bitcoin dominating at 42.7 percent.
** Information on these pages contains forward-looking statements that involve risks and uncertainties. Markets and instruments profiled on this page are for informational purposes only and should not in any way come across as a recommendation to buy or sell in these assets. You should do your own thorough research before making any investment decisions. All risks, losses and costs associated with investing, including total loss of principal, are your responsibility. The views and opinions expressed in this article are those of the authors and do not necessarily reflect the official policy or position of USA GAG nor its advertisers. The author will not be held responsible for information that is found at the end of links posted on this page.