More On: btc
Bitcoin mining hash rate increases by 60% despite falling revenue per terra hash
BTC research: Bitcoin's realized price indicates that a bottom may be forming
Bitcoin sell-off causes $20 million in long positions to be liquidated
Daily Crypto Wrapped: BTC short liquidations exceed $9 million, and Ava Labs CEO calls CryptoLeaks allegations a 'conspiracy theory'
Ethereum (ETH) hits $2000 as Merge nears
Coinciding with concerns about rising inflation, the prospect of several more interest rates by the US Federal Reserve and fears about a global food shortage, global financial markets took a turn for the worst on April 11.
Bitcoin price drop to $39.2K returns it to 'bear market'
Bitcoin (BTC) fell to a one-day low of $39,200 on Monday, as bears broke through bulls' defensive line at $42,000 in the early trading hours, according to Cointelegraph Markets Pro and TradingView data. A number of analysts predict that prices will fall even further.
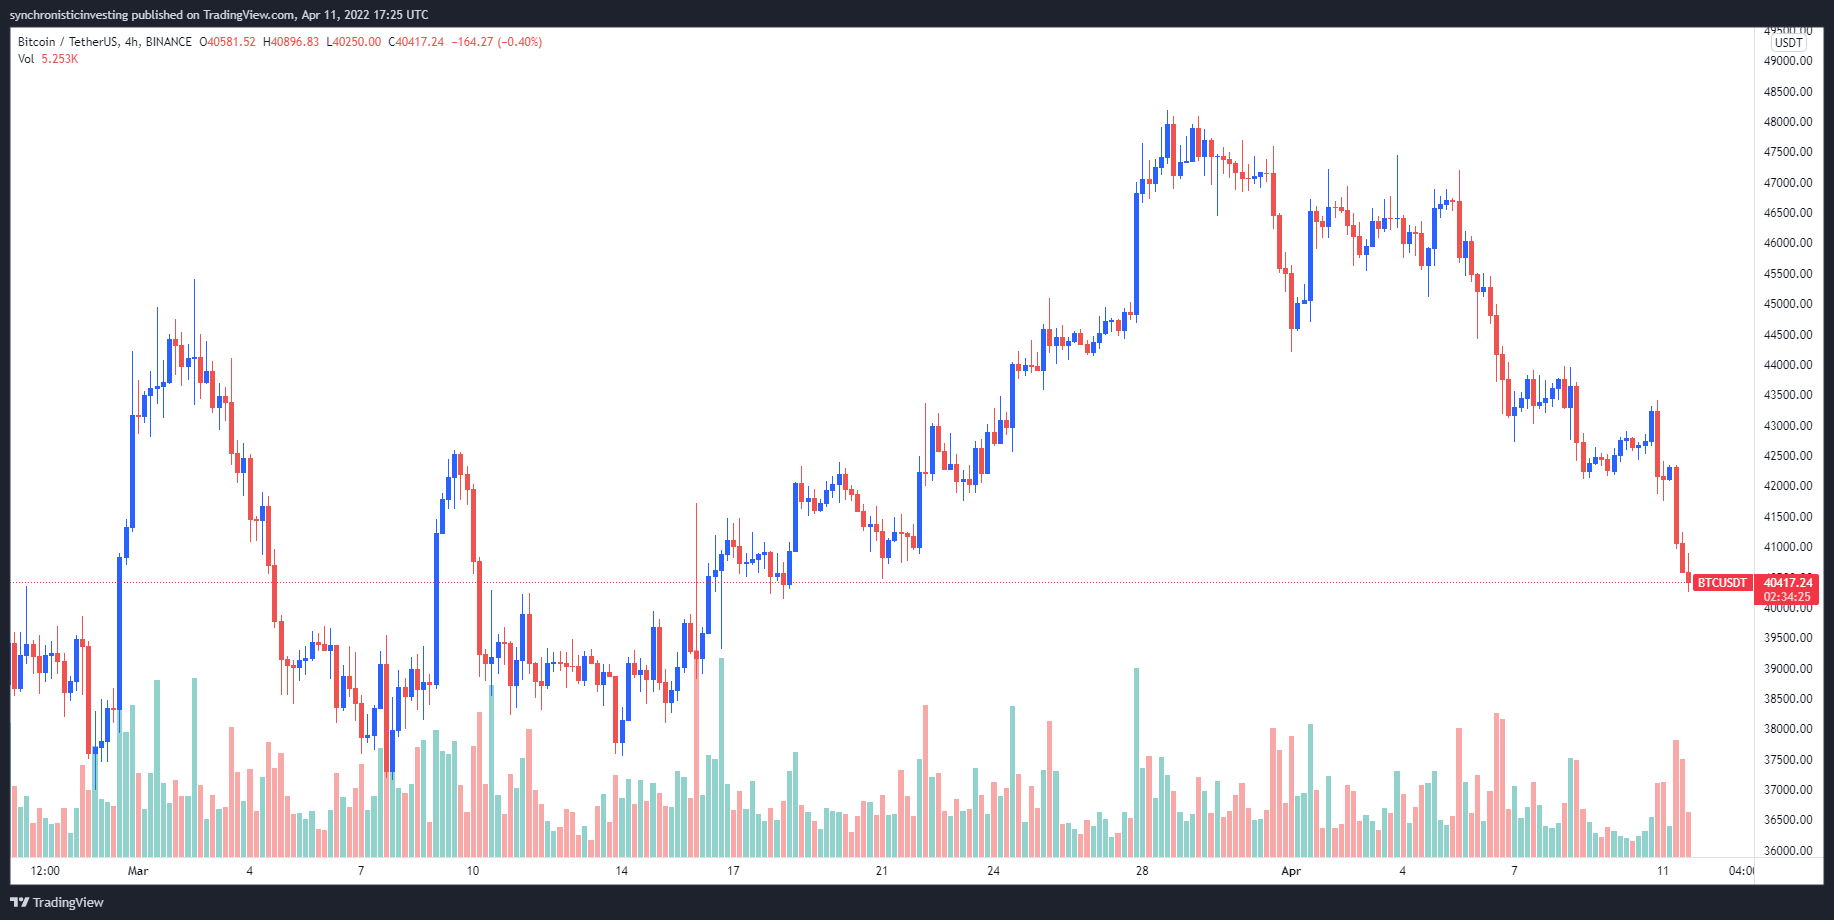
BTC/USDT 1-day chart. Source: TradingView
Here's what analysts think about Monday's decline and whether traders should expect more.
$4000-or-lose
Following the significant advance in Bitcoin, market expert Michal van de Poppe warned that “it's the weekend and we still need to crack this resistance zone.”
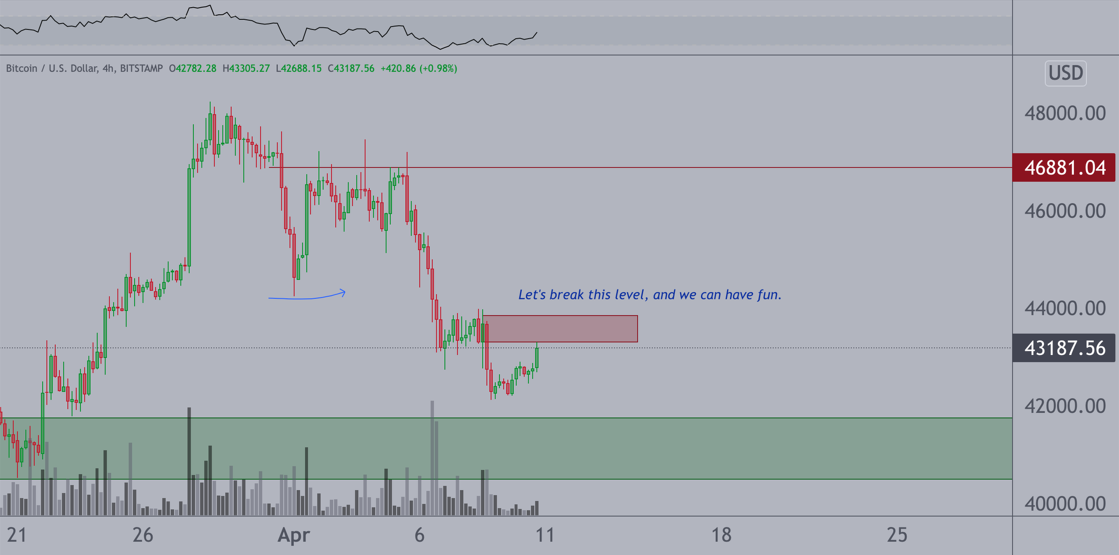
Why $39,000 could influence Bitcoin's price trend
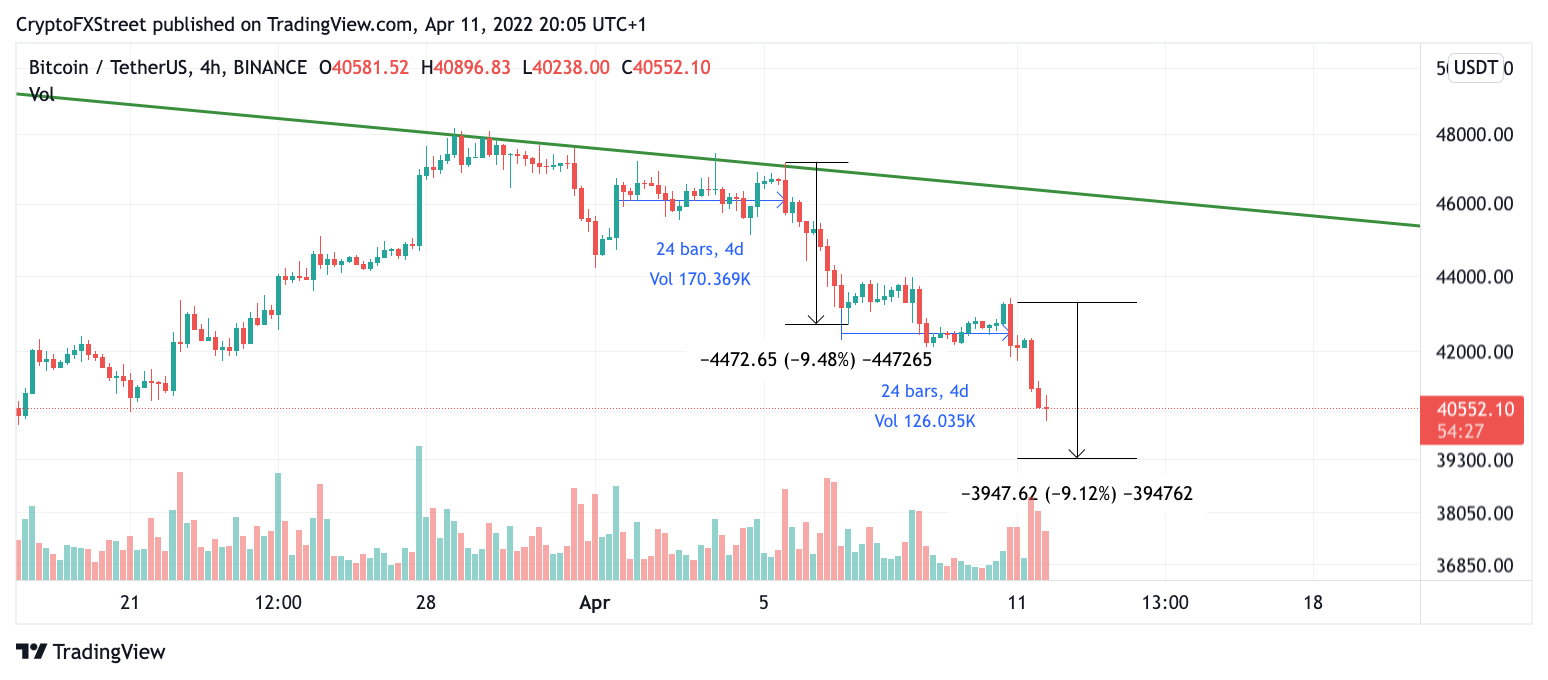
On the 4-hour chart, bitcoin is printing larger bearish engulfing candles than last week. The current selloff appears powerful, with a few confluence zones pointing below $40,000.
The bears appear to be stronger than before.
The bears have shown incredible power to open this week's trading session, and the selloff looks to be just beginning. The present price of $40,780 appears unlikely to hold. Bitcoin's price consolidated for four days before plummeting 10% in one day. Traders should expect similar behavior as the BTC price consolidated for four days over the weekend and the bears have been much more aggressive.
FXStreet analysts predicted significant Bitcoin price decreases last Thursday. Analysts now wonder where the selloff will stop. Similar to last week's selloff, a Fibonacci projection tool puts the mid $38,000 zone at 2.618. The lack of bullish defense in the present BTC price movement will easily violate both goals.
Trade the decline, or wait for a new price pattern on the 4-hour chart to show up before you trade the decline. Over $43,333, the deal won't work. In this case, the $50,000 BTC price target would be reinstated, which would mean a 20% rise in the Bitcoin price over the current price.
** Information on these pages contains forward-looking statements that involve risks and uncertainties. Markets and instruments profiled on this page are for informational purposes only and should not in any way come across as a recommendation to buy or sell in these assets. You should do your own thorough research before making any investment decisions. All risks, losses and costs associated with investing, including total loss of principal, are your responsibility. The views and opinions expressed in this article are those of the authors and do not necessarily reflect the official policy or position of USA GAG nor its advertisers. The author will not be held responsible for information that is found at the end of links posted on this page.