More On: bitcoin
How much 6 popular cryptocurrencies lost in 2022 ?
How people who watch the market were wrong about bitcoin in 2022
Twitter Is Too Musk to Fail
Why Jim Cramer suggests purchasing bitcoin or ethereum, with one exception
El Salvador's bitcoin experiment has cost $375 million so far and lost $60 million
As of this writing, Bitcoin (BTC) has failed to exhibit any clear signals of a positive reversal following the April 6 decline.
Conclusion
- There has been a drop in BTC below the $44,800 mark.
- In this picture, it is trading inside a downward parallel channel.
- Companion Bill to “Mitigate Risks” From El Salvador’s Bitcoin Law
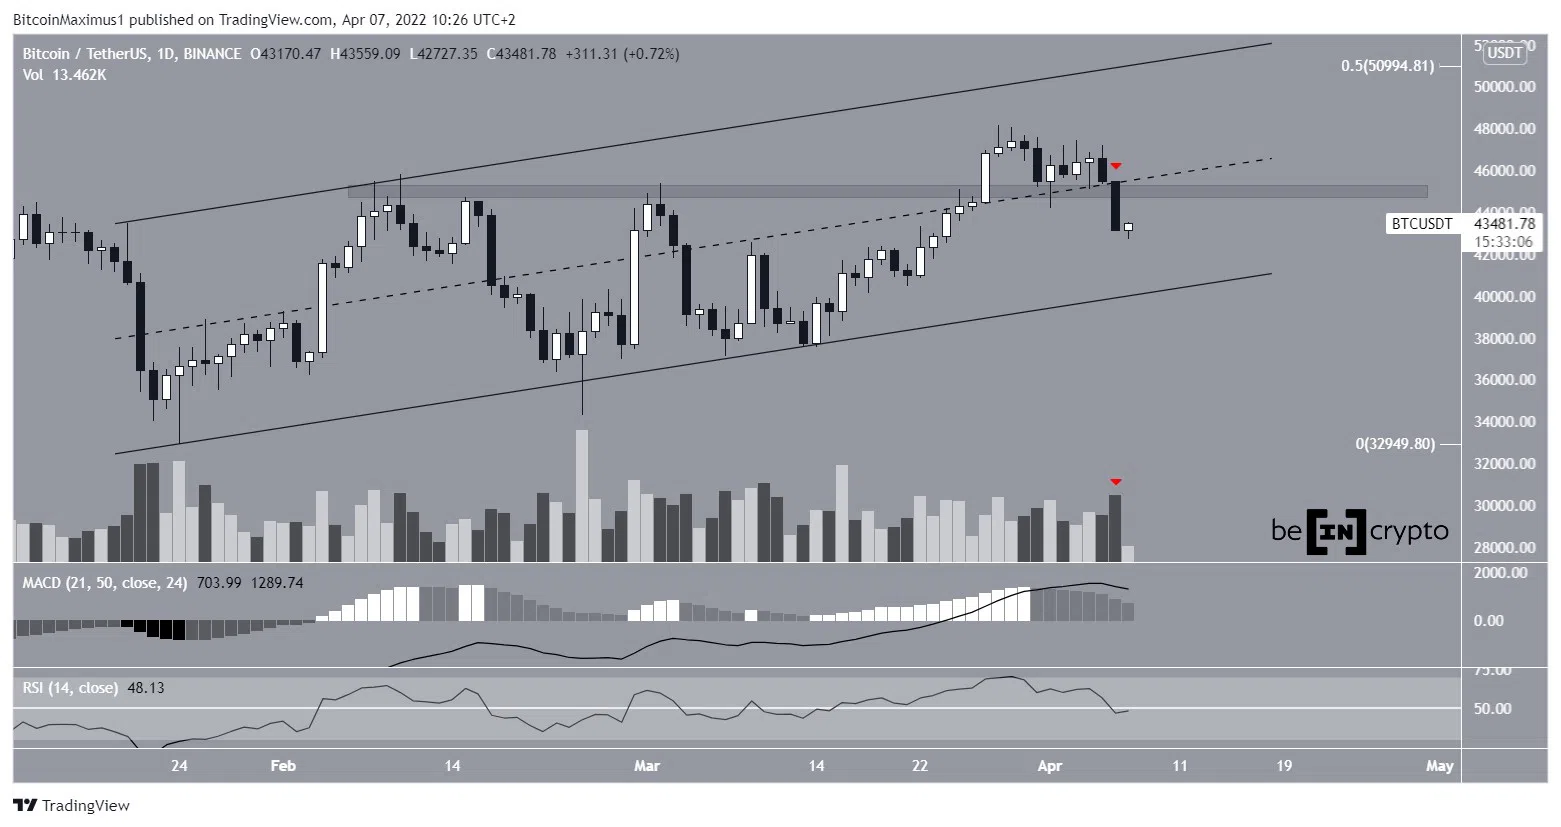
Bitcoin has been falling since it hit a high point of $48,189 on March 28. Initially, the price jumped above the $44,800 area, which seemed to show that it was a support point (green icon). Between February 8 and March 27, the area had been a place of resistance.
BTC, on the other hand, fell after a big bearish candlestick on April 6. The next day, it hit a low of $42,727.
The red icon shows that the decrease did not happen with a lot of volume, and the MACD and RSI are still positive. However, the $44,800 area is now seen as a barrier.
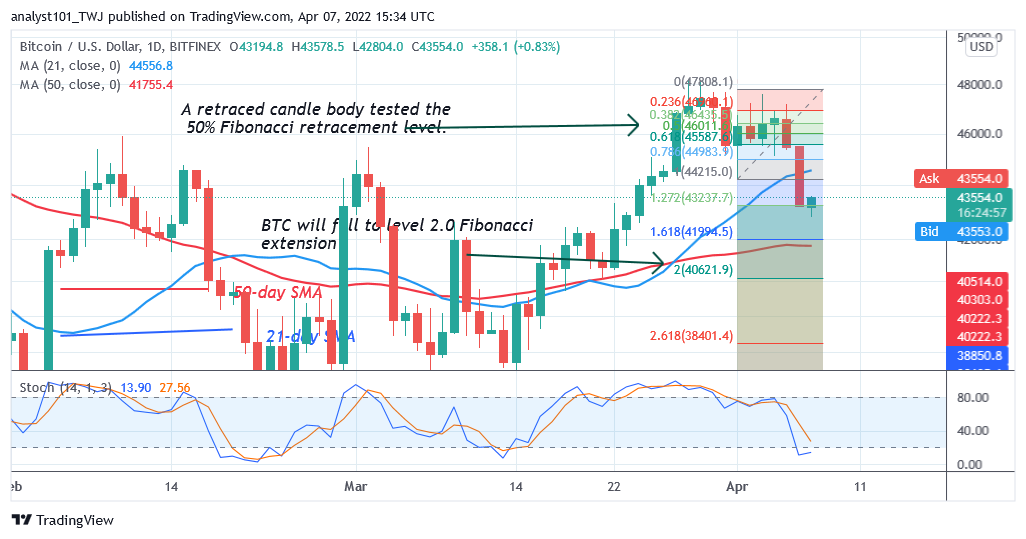
There's a support area at $40,400 in the daily time frame A rising support line has been in place since Jan. 24, and this target is right where it is now.
Can BTC take back the $44,800 area?
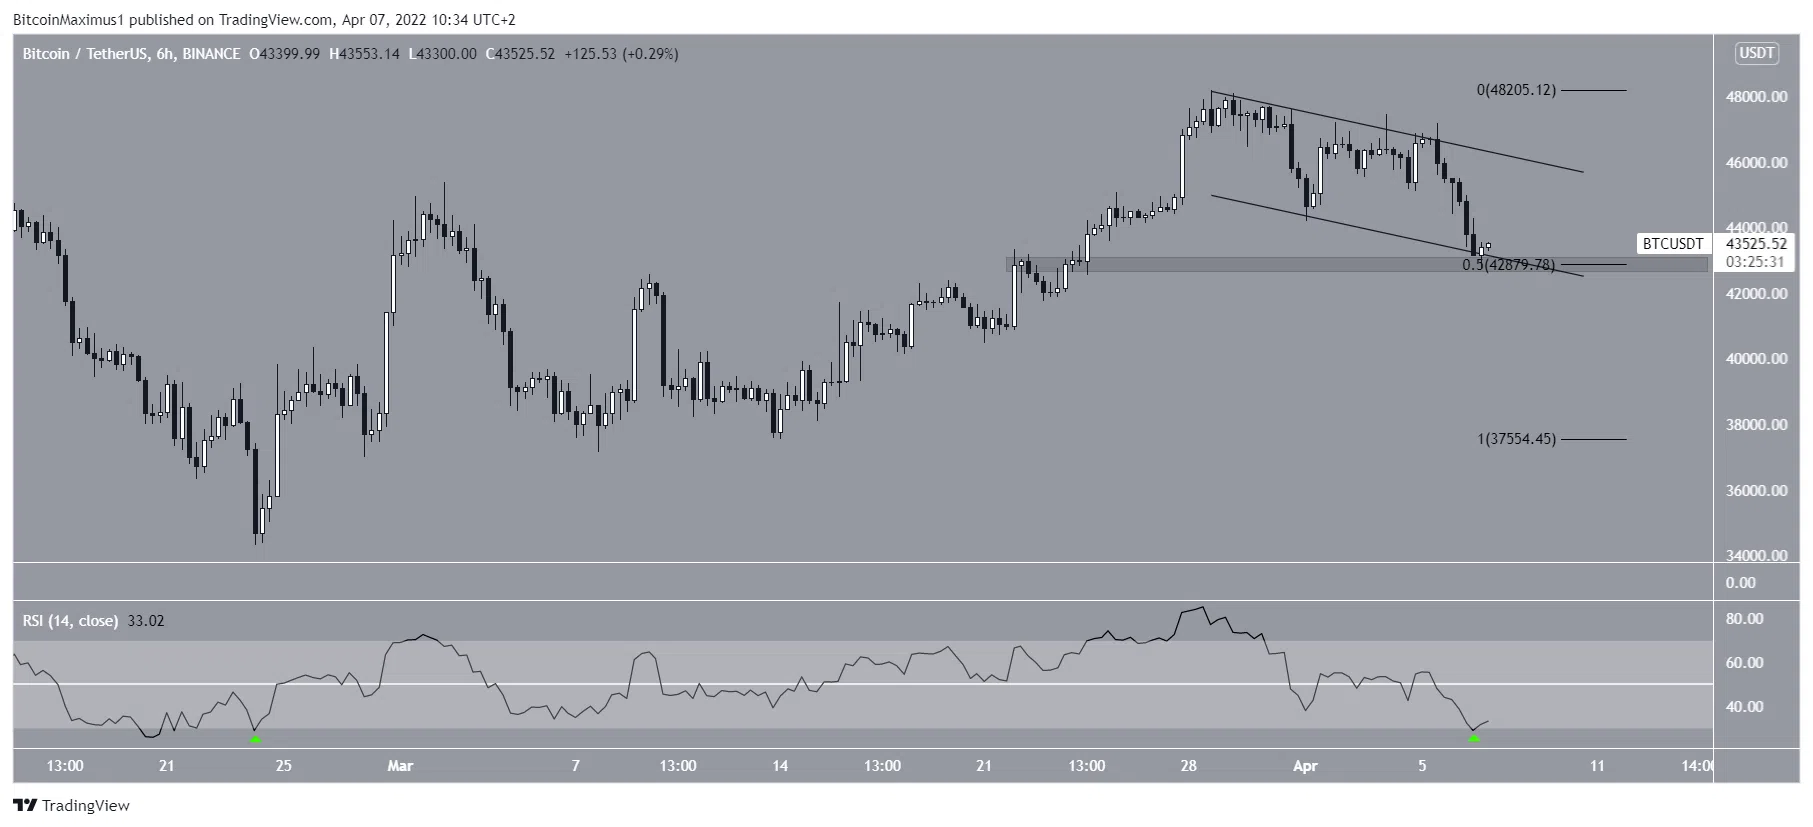
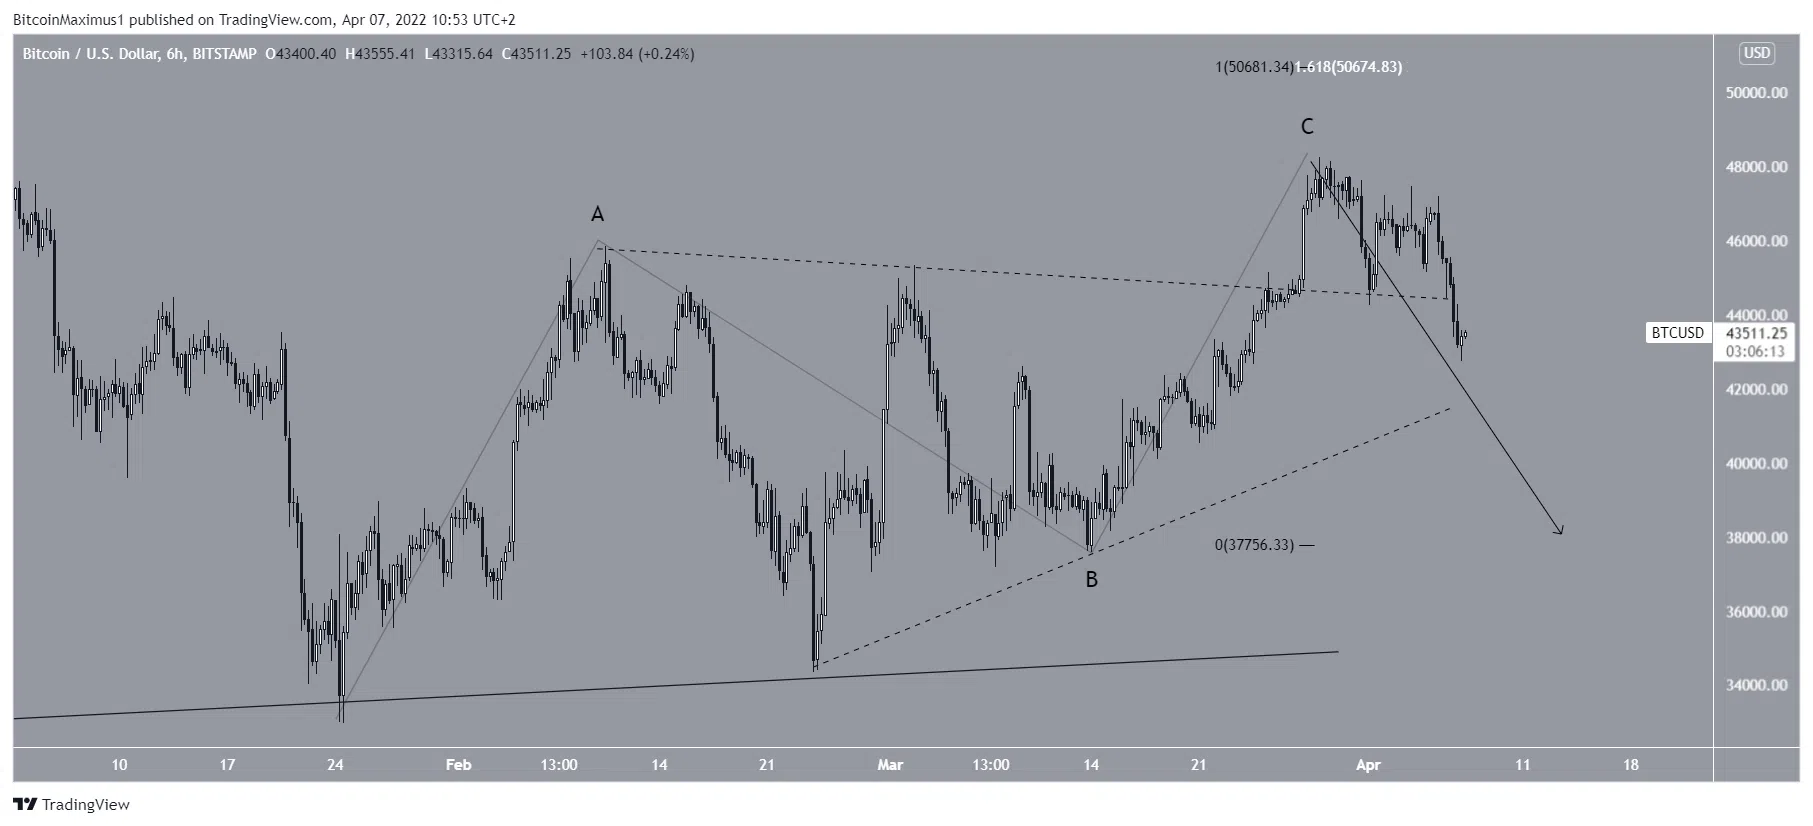
The six-hour chart shows that BTC has been trading inside a descending parallel channel since March 28. This means that the price has been going down. Such channels are usually filled with corrective movements, which means that a break from them would be expected at some point.
On April 7th, BTC hit the support line of the channel and began its current upward trajectory. The bounce also happened at $42,900, where the 0.5 Fib retracement support level and a horizontal support region formed a confluence of support levels.
The oversold RSI (green icon) is the only sign that the market is about to turn around.
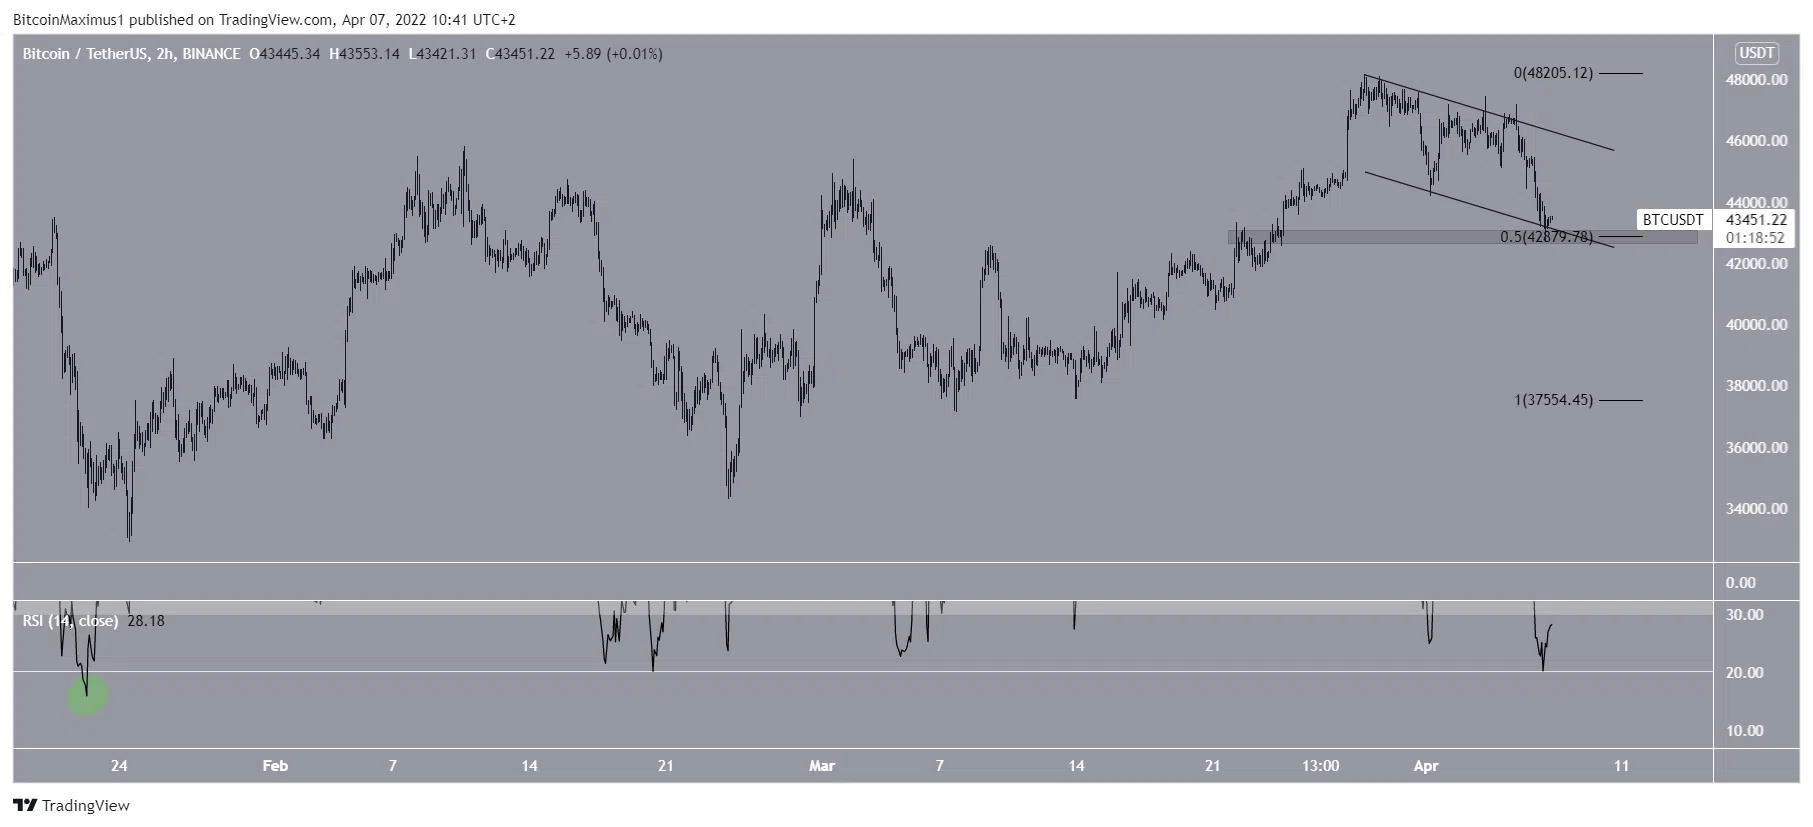
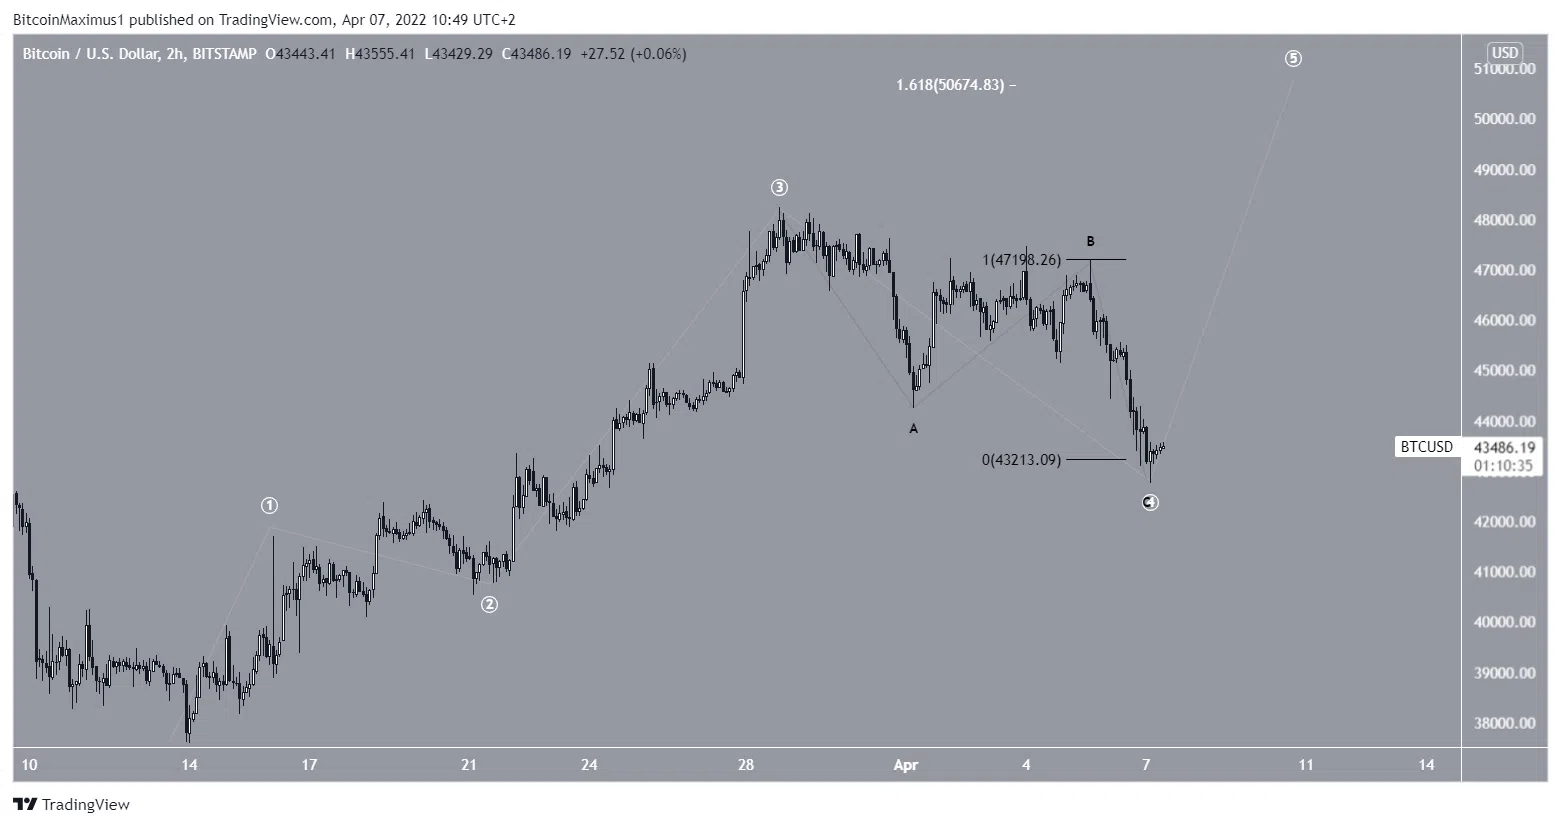
The two-hour chart paints a similar picture and shows that the RSI has not been this oversold since the Jan. 24 bottom (green circle).
This is a study of wave counts.
There's still a chance that the whole drop is the end of wave 4, and then Bitcoin will start going up again to $50,700. For example, the channel we saw before and the fact that sub-wave A and C have a close to 1:1 ratio is why this is the case.
This scenario would be thrown out if the rate of decline continued.
A-B-C structure (black): If that's the case, then BTC has already done that and will now fall below $40,000.
The direction of the long-term trend will depend on whether or not BTC is able to rebound at this level.
As a follow-up to the Bitcoin law in El Salvador, this bill aims to "minimize risks."
California Rep. Norma Torres and Arkansas Rep. Rick Crawford are both in the House of Representatives. The two Representatives have proposed legislation that they hope will help protect the United States' financial system from the risks posed by El Salvador's adoption of Bitcoin as a legal form of currency. If you want to keep your money safe from what El Salvador is doing, you need to have a plan in place, says Norma Torres. She also cited the International Monetary Fund's reports on threats to financial stability, financial integrity, and consumer protection, which she said were important to keep in mind. It is important for the United States to have a plan in place in order to protect its financial systems from the risks that this decision could pose, said Torres. "El Salvador is an independent democracy, and we respect its right to self-govern," said Torres.
At the same time, the BTC price has dropped to $43,162. Bitcoin is facing rejection at $43.9K. If you try to go up, you're going to get turned down at the high point of $43,901. If the current support level is broken, the selling pressure will start again. If you sell Bitcoin, you'll be pushed toward a low of $37,000.
** Information on these pages contains forward-looking statements that involve risks and uncertainties. Markets and instruments profiled on this page are for informational purposes only and should not in any way come across as a recommendation to buy or sell in these assets. You should do your own thorough research before making any investment decisions. All risks, losses and costs associated with investing, including total loss of principal, are your responsibility. The views and opinions expressed in this article are those of the authors and do not necessarily reflect the official policy or position of USA GAG nor its advertisers. The author will not be held responsible for information that is found at the end of links posted on this page.