More On: bitcoin
How much 6 popular cryptocurrencies lost in 2022 ?
How people who watch the market were wrong about bitcoin in 2022
Twitter Is Too Musk to Fail
Why Jim Cramer suggests purchasing bitcoin or ethereum, with one exception
El Salvador's bitcoin experiment has cost $375 million so far and lost $60 million
Bitcoin (BTC) appears to have ended its short-term slump after bouncing at a confluence of support levels.
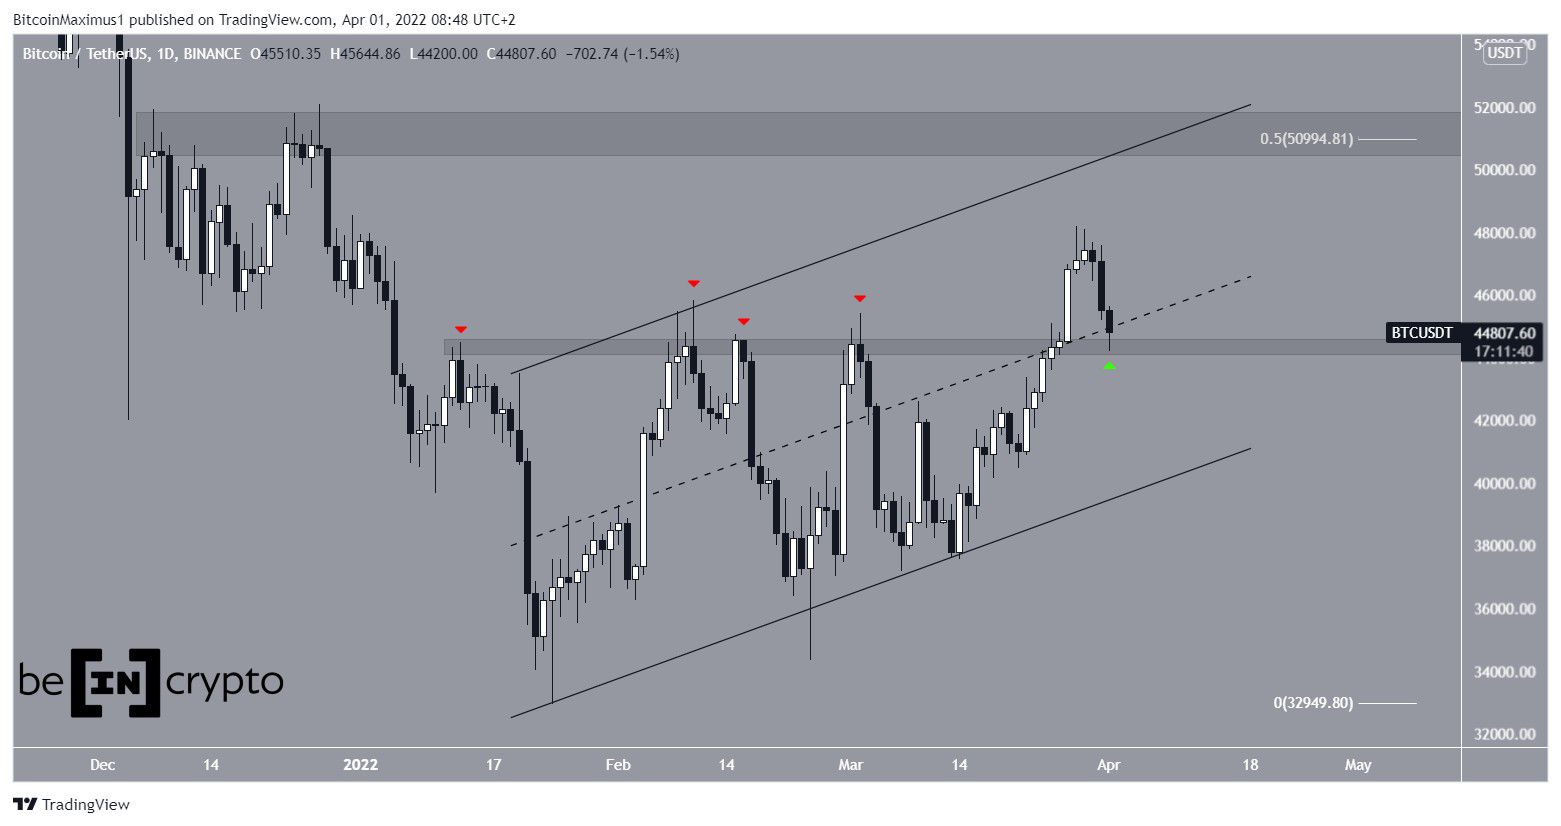
Since January 24, BTC has been growing in an upward parallel channel. The rise has thus far resulted in a March 28 high of $48,189.
While the price has continued to decline thereafter, it recovered on April 1 at a confluence of support levels (green icon). The support level is $44,450, a price level that has previously performed as resistance four times (red icons). It is possible that the area has now shifted to a support role.
Additionally, the location is located in the center of the rising parallel channel.
If the BTC price continues to rise following this bounce, the nearest resistance level would be $51,000. This is the 0.5 Fib retracement level of resistance measured from the all-time high price. Additionally, it is a horizontal resistance area that aligns with the parallel channel's resistance line.
BTC's short-term movement
When assessing the most recent phase of the upward rise, the two-hour chart shows that BTC has bounced at the 0.382 Fib retracement support level.
Additionally, this is a short-term horizontal support zone.
Additionally, the two-hour RSI has decreased to 25. This is an oversold value that was last attained on March 14. (green circle).
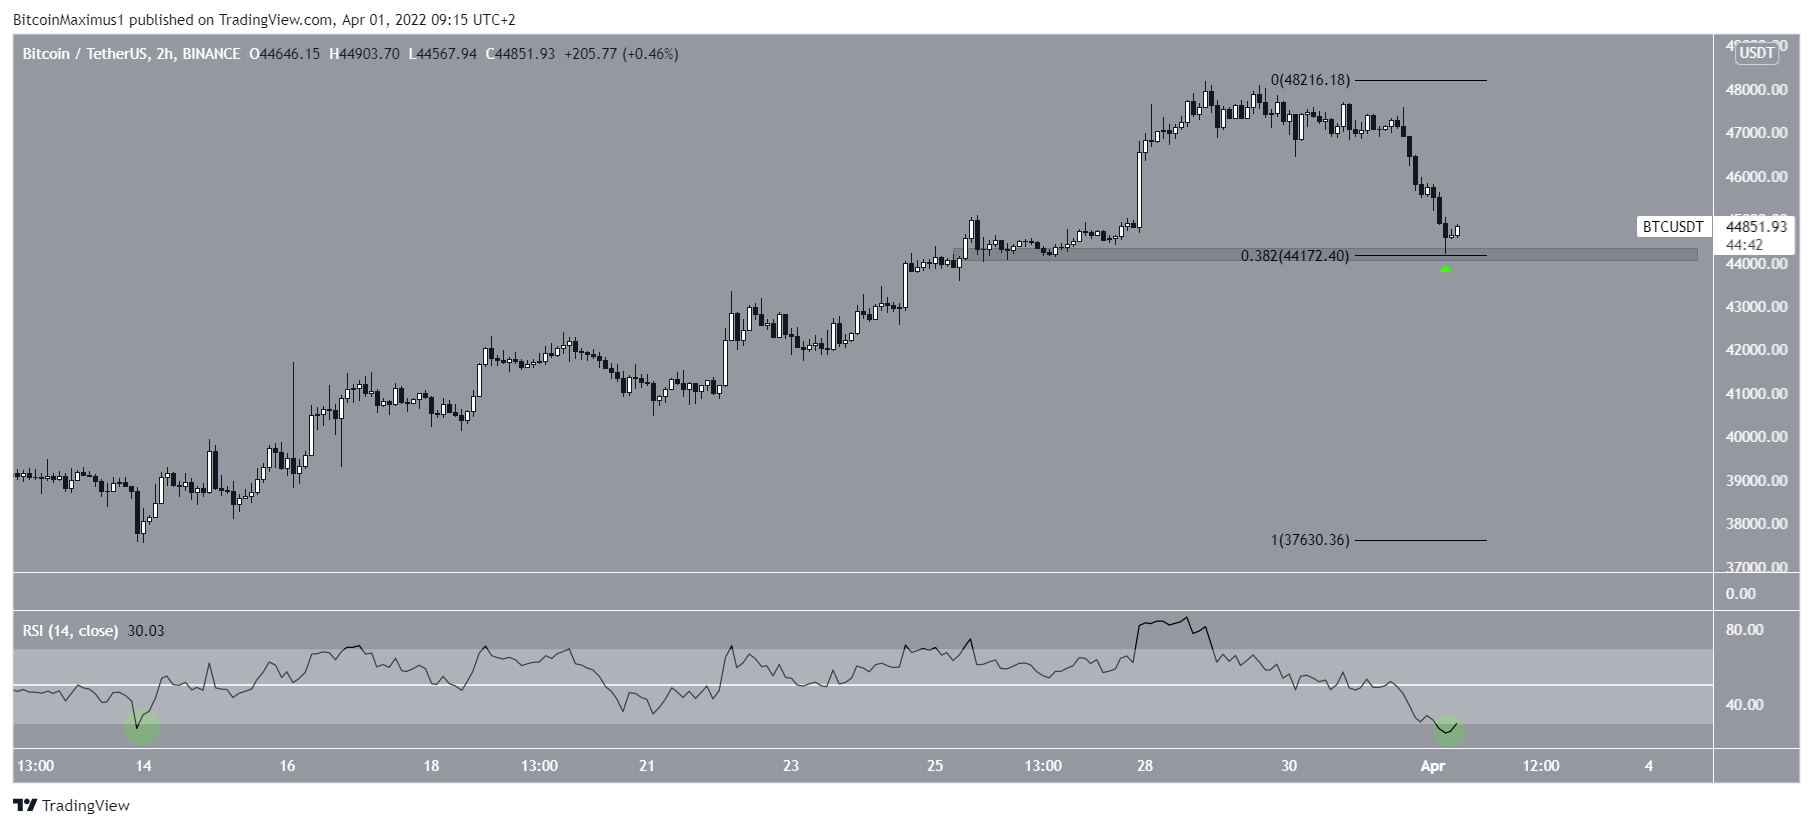
The price then began a substantial upward rise that culminated in the present highs.
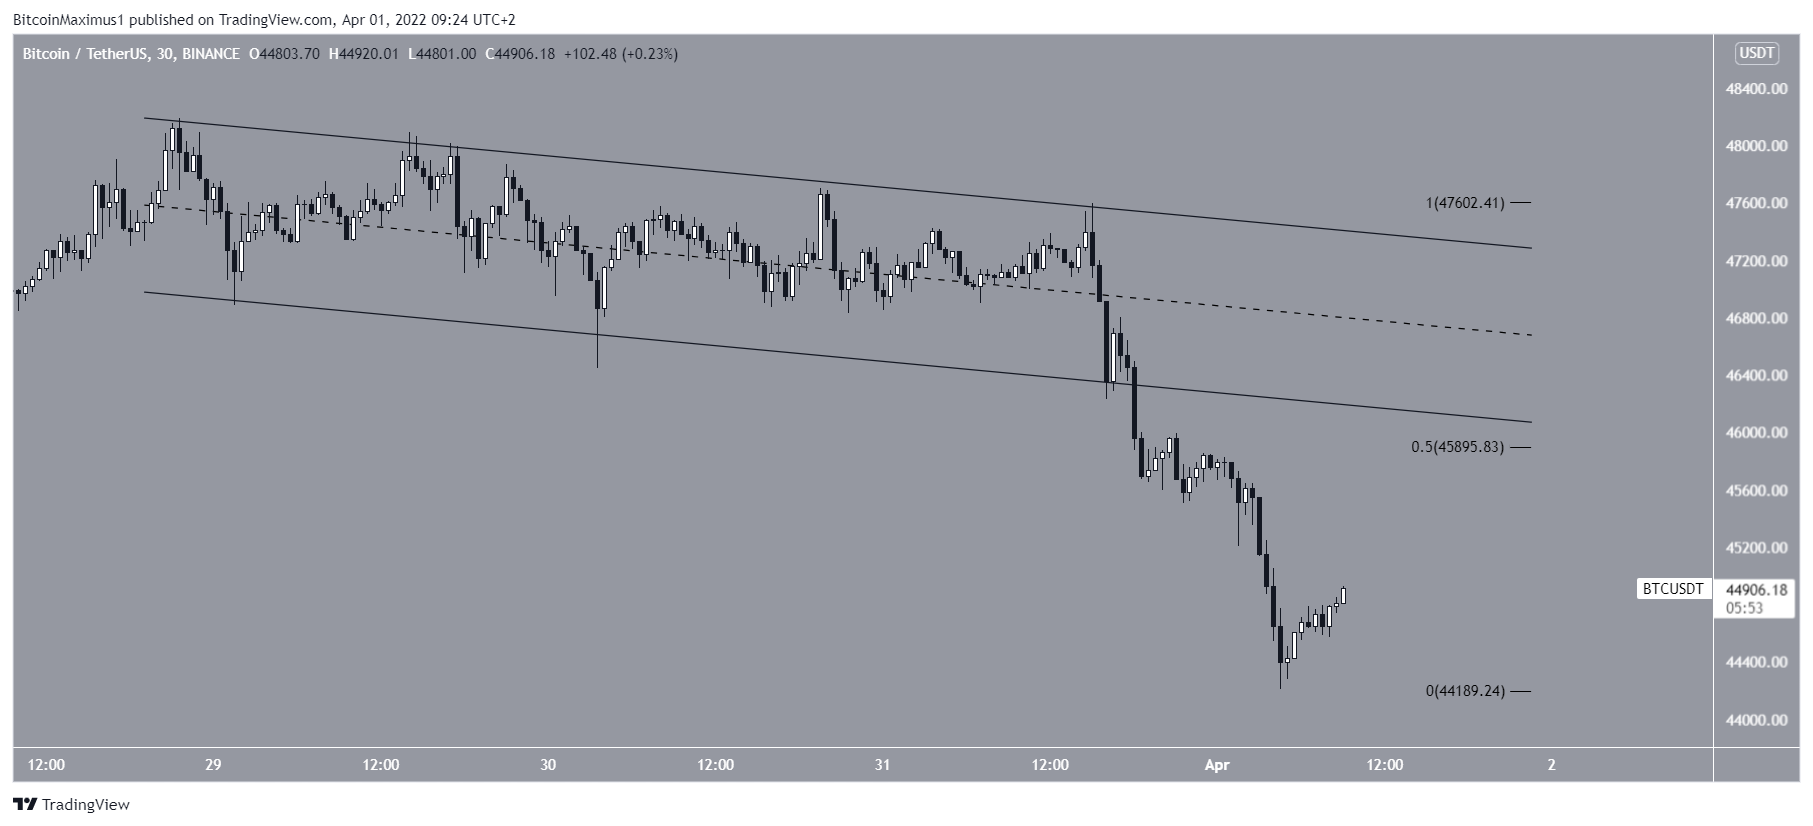
If BTC bounces, resistance will be found at $45,900. This is the 0.5 Fib retracement resistance level, which coincides with the previous declining parallel channel's support line.
If reclaimed, this would demonstrate conclusively that the repair is complete.
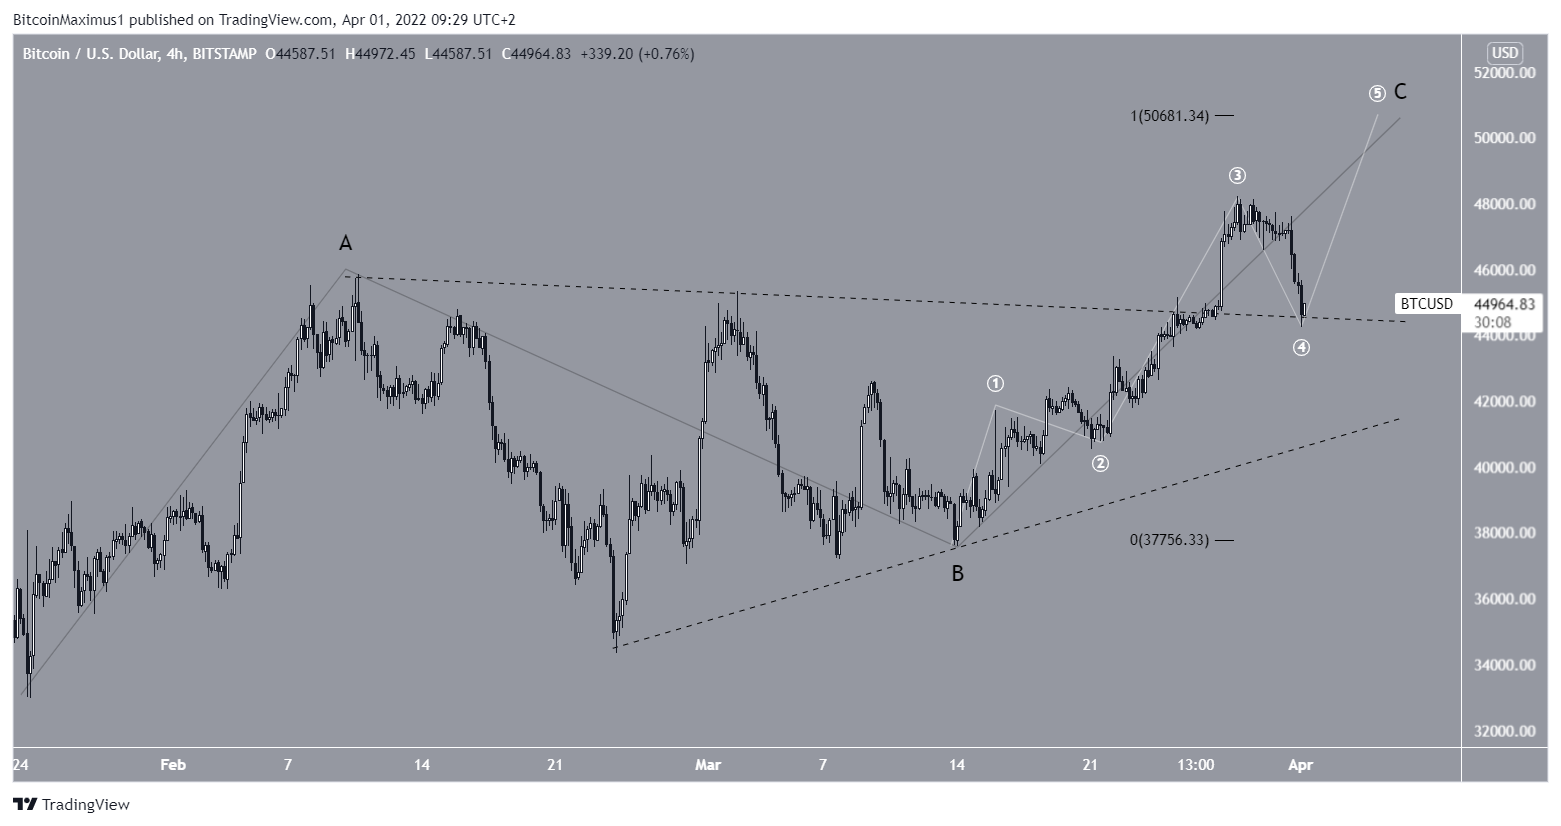
Analyses of wave counts
According to the wave count, BTC is in wave C of an A-B-C structure (black).
The white sub-wave count indicates that the price has recently finished sub-wave four.
As a result, wave five is likely to push the price to $50,600. This would result in a 1:1 ratio between waves A and C and would be extremely near to the previously identified $51,000 resistance level.
** Information on these pages contains forward-looking statements that involve risks and uncertainties. Markets and instruments profiled on this page are for informational purposes only and should not in any way come across as a recommendation to buy or sell in these assets. You should do your own thorough research before making any investment decisions. All risks, losses and costs associated with investing, including total loss of principal, are your responsibility. The views and opinions expressed in this article are those of the authors and do not necessarily reflect the official policy or position of USA GAG nor its advertisers. The author will not be held responsible for information that is found at the end of links posted on this page.