More On: bitcoin
How much 6 popular cryptocurrencies lost in 2022 ?
How people who watch the market were wrong about bitcoin in 2022
Twitter Is Too Musk to Fail
Why Jim Cramer suggests purchasing bitcoin or ethereum, with one exception
El Salvador's bitcoin experiment has cost $375 million so far and lost $60 million
BTC bulls are expected to make a comeback, sending the price of the digital currency to the $44,000 barrier, according to the latest price predictions.
BTC/USD Long-term Trend: Ranging (Daily Chart)
Key levels: Resistance Levels: $48,000, $50,000, $52,000
Support Levels: $38,000, $36,000, $34,000

Bitcoin/USD has rebounded from $46,000 after a negative correction on the daily chart. Bitcoin/USD has rebounded from intraday lows of $42,118 to trade at $42,477 in the European session today. As the king coin rises toward the 9-day and 21-day moving averages, its price is currently 0.51 percent higher on the day.
It is predicted that the price of Bitcoin (BTC) would rise above $44,000.
The Bitcoin price has yet to fall below the $42,000 barrier on the daily chart. As a result, the first digital asset is presently approaching the moving averages. The Relative Strength Index (14), a technical indicator, shows that the signal line is expected to cross above the 50-level, indicating that the Bitcoin price will once again climb towards $45,000, which is the potential resistance level.
If the price breaks above the 9-day and the 21-day moving averages over $48,000, $50,000, and $52,000, we could see a significant bullish rise above these levels. And should the sell-off continue to fail to restrain itself, BTC/USD might fall below the support levels of $38,000, $36,000, and even more critically, $34,000 in the short term if the market takes a sharp turn south.
Bearish long-term trend This is a 4H Chart
BTC is currently trading at $42,509 on the 4-hour chart. However, despite the fact that Bitcoin has yet to reach $43,000, it appears to be making a reversal. As a result, it may take some time for Bitcoin's price to rise above the resistance of the 9-day and 21-day moving averages.
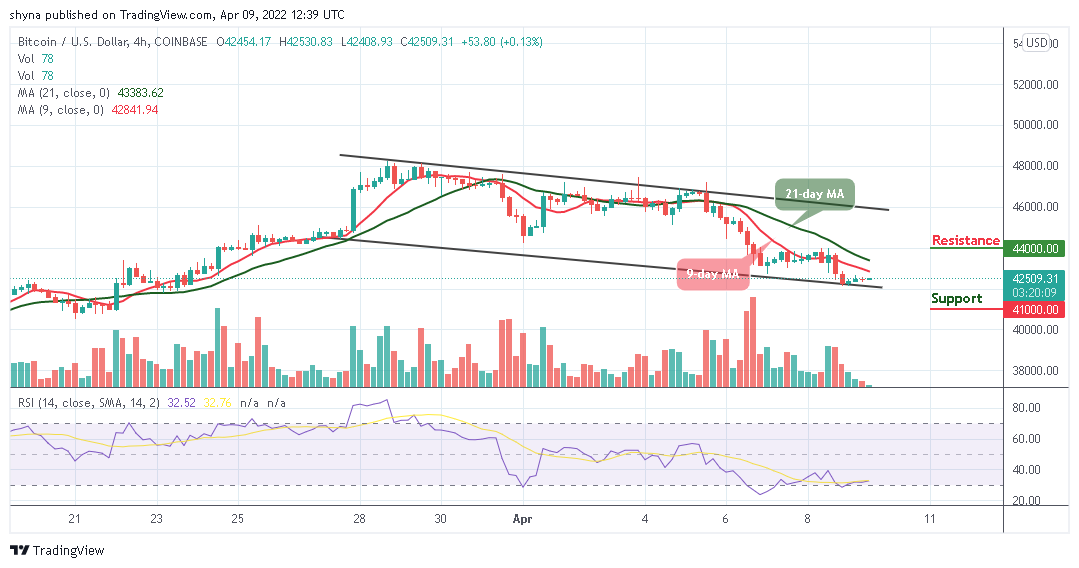
The technical indicator Relative Strength Index (14) is moving in the same direction as BTC/USD at the moment, and the upward movement may bring the currency to hit the nearest resistance level at $44,000 and above, while the immediate support comes at $41,000 and lower.
** Information on these pages contains forward-looking statements that involve risks and uncertainties. Markets and instruments profiled on this page are for informational purposes only and should not in any way come across as a recommendation to buy or sell in these assets. You should do your own thorough research before making any investment decisions. All risks, losses and costs associated with investing, including total loss of principal, are your responsibility. The views and opinions expressed in this article are those of the authors and do not necessarily reflect the official policy or position of USA GAG nor its advertisers. The author will not be held responsible for information that is found at the end of links posted on this page.