More On: Economics
The Economics of Culture and the Arts
Histories demonstrate that high inflation can persist for over a decade
The rate of inflation drops to 7.1%, but it still has a long way to go down
Wall Street wants to raise the target inflation rate above 2%. This is not a surprise
Prices went up a lot in August, which means that earnings went down again
Following the housing bubble of 2008, the government allegedly established a fail-safe mortgage program to avert future bubbles. It didn't work.
Is the current property market a bubble about to burst? If so, what is the source of the market distortion and how big is it? The possibility of a housing bubble has been discussed recently, particularly before Fed officials started on a warpath against inflation as measured by the Consumer Price Index (CPI). I've been questioned about this, and the following is a condensed response to all of them.
In 2005, I was requested to contribute a chapter on housing bubbles to a book on housing economics and government intervention that was in the works. Government planning, zoning, eminent domain, and different government subsidies would occupy a large portion of the book. In contrast to the many "micro" housing concerns, my chapter would be a "macro" topic.
Since 2003, I had been studying and writing about the then-current housing bubble (HB1), having recently left a position as Assistant Superintendent of Banking in Alabama to take a macroeconomics professorship at Columbus State University in Georgia.
I wrote for LewRockwell.com and Mises.org about the housing bubble and in 2005 I published my article “Skyscrapers and Business Cycles” in the Quarterly Journal of Austrian Economics which made the general theoretical connection between Fed policy and real estate investments and in this case, the connection between Fed policy, record setting skyscrapers, and economic chaos.
My chapter was submitted in 2006, but it was not included in the intended book until 2009, when the bubble burst. Not only did the editors invite me to include content that had been removed from the final published version because it was too controversial. They also mentioned my chapter in the beginning of their book's introduction:
To the extent that the media was aware of my work, especially on the skyscraper curse, the response and level of appreciation was mixed. On the one hand, CNN was positive, if not surprised, that my work was so accurate and specific:
One person who wasn't surprised by the economic woes greeting the dedication of the Burj Khalifa (renamed Monday from Burj Dubai in honor of the sheikh of Abu Dhabi, which recently threw Dubai a $10 billion lifeline) was Auburn University economist Mark Thornton.
He predicted tough times for the emirate two years ago in a blog post entitled "New Record Skyscraper (and Depression?) in the Making." He noted that economic depression or stock market collapse usually occurs prior to completion of such skyscrapers.
On the other hand, The Economist took my “skyscraper curse” model to task because it did not stand up to somebody else’s poor understanding of the data involved. The magazine did not actually use my name in their article, although my academic article is listed in their reference list although my name was missing there too. My letter to their editor was not published and after many months I was extremely surprised to receive an email from them saying that my letter to the editor had been misplaced. Despite its discovery, they did not publish it. Extremely odd?
Review of the Charts
I'll go over the charts I used in my 2006/2009 chapter again, and then update them for the current housing bubble. As you can see, the Fed plainly did not learn its lesson and has re-entered the cookie jar. Of course, there's a lot more to say about the housing bubble, but I'll just say that it's veiled in what my friend Keven Duffy aptly calls the "everything bubble."
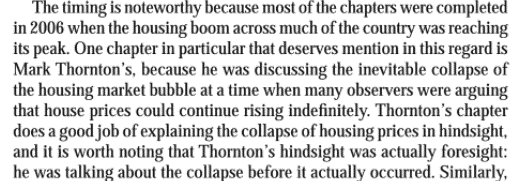
The first graph is based on the Fed's main policy interest rate, the Federal Funds Rate. They have direct influence over it, and it sets the precedent for most other interest rates in the economy because it is the interest rate that banks charge other banks for extremely short-term loans.
Although I finished my chapter in early 2006, I had been researching and writing on the first housing bubble since early 2004. The document was not released until 2009, long after the bubble had burst and policymakers at the Federal Reserve and elsewhere were busy trying to cover up their mistakes.
Seven years of near-zero interest rates followed, as did several rounds of bailouts and quantitative easing. In 2016, as the Fed attempted to create a return to normalcy and a soft landing, this changed. It didn't work, so the Fed went into panic mode with a return to zero rates and quantitative easing, as well as the federal government's extraordinary fiscal stimulus, all under the guise of the covid-19 crisis.
The Fed has re-entered a normalcy/tightening phase, which has only recently begun, as seen on the far left of the graph. The Federal Reserve has yet to boost its target rate above 1%. Until after the November election, balance sheet reductions will be minor. Given CPI inflation of over 8%, their response has been extremely sluggish thus far.
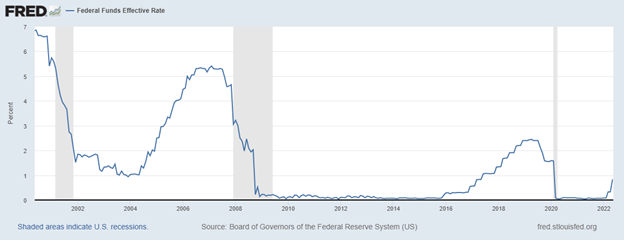
A significant driver of housing bubbles is the thirty-year fixed-rate mortgage. The 6% rate that generated the previous housing bubble may appear high in comparison to recent years, but it is the lowest rate since we abandoned the gold standard in 1971.
The most extraordinary rates occurred only in the last few years, when the Fed's policy rate was driven near zero, significant quantitative easing, including massive purchases of mortgage-backed securities (MBS), and low CPI inflation resulted in the lowest rates ever, often less than 3%!
The Fed's top policymakers' verbal war on CPI inflation, threatening significant and persistent rate hikes and massive balance sheet reductions, paired with out-of-control CPI inflation, has pushed market mortgage rates beyond 5%. The recent shift away from variable rate mortgages and toward fixed rate mortgages should protect current holders, but it could also hurt potential home buyers, mortgage investors, banks, the Federal Deposit Insurance Corporation (FDIC), and even the Federal Reserve, which is the largest mortgage investor.
If the CPI does not fall soon, the Fed will have to raise rates significantly, causing a drop in housing indicators such as prices and new permits—the new housing bubble would burst. A top Fed official was recently asked on Bloomberg if its policy could lower home prices and make them more affordable for first-time buyers. The official coughed fast and stated that the Fed would never lower housing prices, merely the rate of rise. I'm glad that's not my line of work!
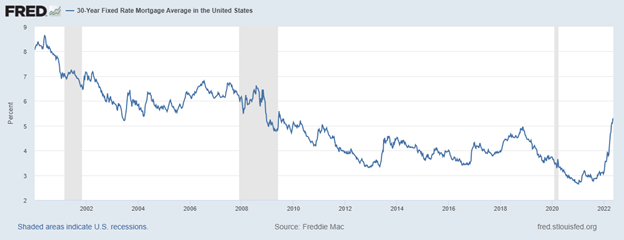
In the twenty years prior to completing my paper the total amount of real estate loans at commercial banks increased from $1 trillion to $3 trillion, a massive $2 trillion increase. That same number increased from $3 to $5 trillion, another $2 trillion increase over the last fifteen years despite a soft or negative overall market from 2009 to 2015.
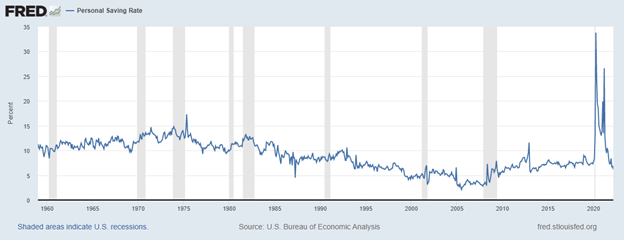
On the gold standard, the personal saving rate was above 10%, and few individuals were on the dole. Since 1971, when we stopped using gold, our savings rate has been decreasing, and it was approaching zero when I finished my chapter in 2006. It has now climbed to a higher level, but it has remained below the gold standard percent-of-income level, until the covid-19 crisis occurred in March 2020, when the Fed went into inflationary panic mode. In addition, the federal government accumulated large deficits while engaging in numerous rounds of "stimulus" vote buying sprees. With large amounts of free money and historic economic uncertainty, personal saving rates soared to almost 25%, before settling back to a range of five to ten percent.
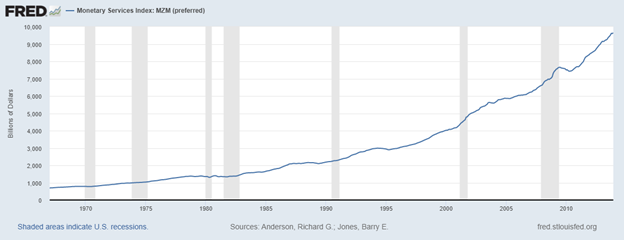
The money supply as measured by the MZM statistics increased by 50 percent during the first housing bubble and has increased another 50 percent since then, increasing in the last few years from roughly $6 trillion to $9 trillion. Obviously, the Fed is trying to do the impossible, which is to engineer and print the economy to prosperity, or whatever goal they are pursuing.
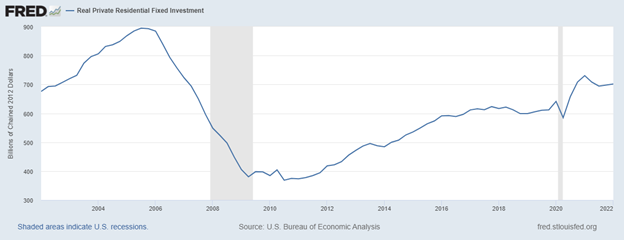
The amount of Real Private Residential Fixed Investment surged significantly during the previous housing bubble, nearly doubling in the fifteen years leading up to the bubble's demise. It nearly doubled again during the second housing bubble. During the previous housing bubble, I noted that home investment surged even during the prior recession, signaling the start of the boom. Investment also increased during the recent short recession in 2020, suggesting that the present bubble is still in its early stages.
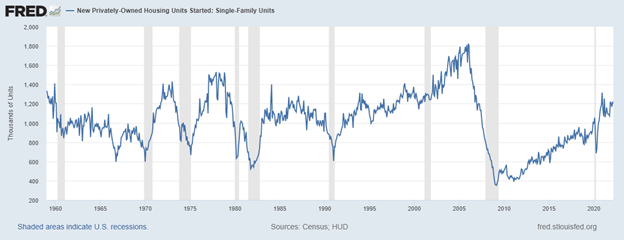
The amount of single-family housing starts, as assessed by the New Privately Owned Housing Units statistics, is another useful indicator of housing. During the previous bubble's fifteen years, that number climbed significantly before plummeting to a new low. Since the previous bubble burst, housing starts have followed a similar pattern. Although it has not yet reached the same height as the last bubble, the absolute increase has been similar, and the number of multi-unit dwellings has far exceeded that of the previous bubble. In addition, the number of jobs in the construction business has returned to prior highs seen during the previous housing boom.
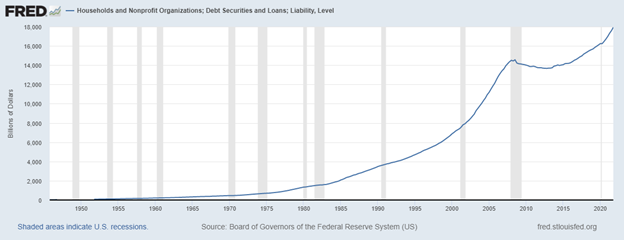
During the previous housing bubble, the quantity of household debt surged dramatically and continued to rise for two years after my paper was written, before collapsing and tapering off for several years before being reignited and reaching new highs. Despite the covid-19 crisis phase of higher home savings, household debt has surged by nearly 30% since mid-2013.
There are a variety of possible causes for the soaring housing and construction markets, but I've been predicting a bubble for many years. My prediction is that, while it may continue for some time, we will eventually see that the Fed made mistakes.
Prior to the last house price crisis, Fed officials assured us that there was no housing bubble, that the Fed possessed near-omniscience and authority, and that they would intervene swiftly to avert a housing bubble or bust. They claim it was due to their own transparency, but it was actually a deception of us.
The Fed was given new powers and authority, Congress passed sweeping regulatory and reporting requirements, and the general public became much more skeptical of house flipping, multiple home ownership, and the allure of "housing prices never go down" and "no one ever lost money in real estate" maxims.
People are nevertheless keen to buy a property, despite the exorbitant prices. Prices are being bought up higher than the asking price. Home inventories are non-existent in some markets, while available properties are snapped up in others. That homebuyers are caught in a vicious circle of rising prices and rising borrowing rates. That recent buyers can profitably resell. To me, these are all echoes of a housing bubble that is about to burst.
======


