More On: cosmos
Osmosis has released a demo NFT builder
Bitcoin Cash, Cosmos, and Aave Price Analysis for October 21st
Scientists study moving worm "blobs" to create robot swarms
Venus flytrap jaws create tiny magnetic fields when they snap shut
Video: Here's what it's like to orbit the moon in real time
While Bitcoin’s price rallied and breached the $67,000-mark, altcoins’ price action projected the resultant domino effect.
Many altcoins, including Bitcoin cash, Cosmos, and Aave, saw bullish price action in the short to medium term. However, an examination of Aave revealed indications of an overbought position.
Bitcoin Cash [BCH]
The Relative Strength Index (RSI) was well above the midpoint at 65, indicating increasing buying strength. The MACD was above the Signal Line, indicating a bullish trend. This reading was accommodated by the histogram, which flashed green signal bars.
The press time trading price was near the upper band of the Bollinger Bands, indicating that BCH may be overbought.
Cosmos [ATOM]

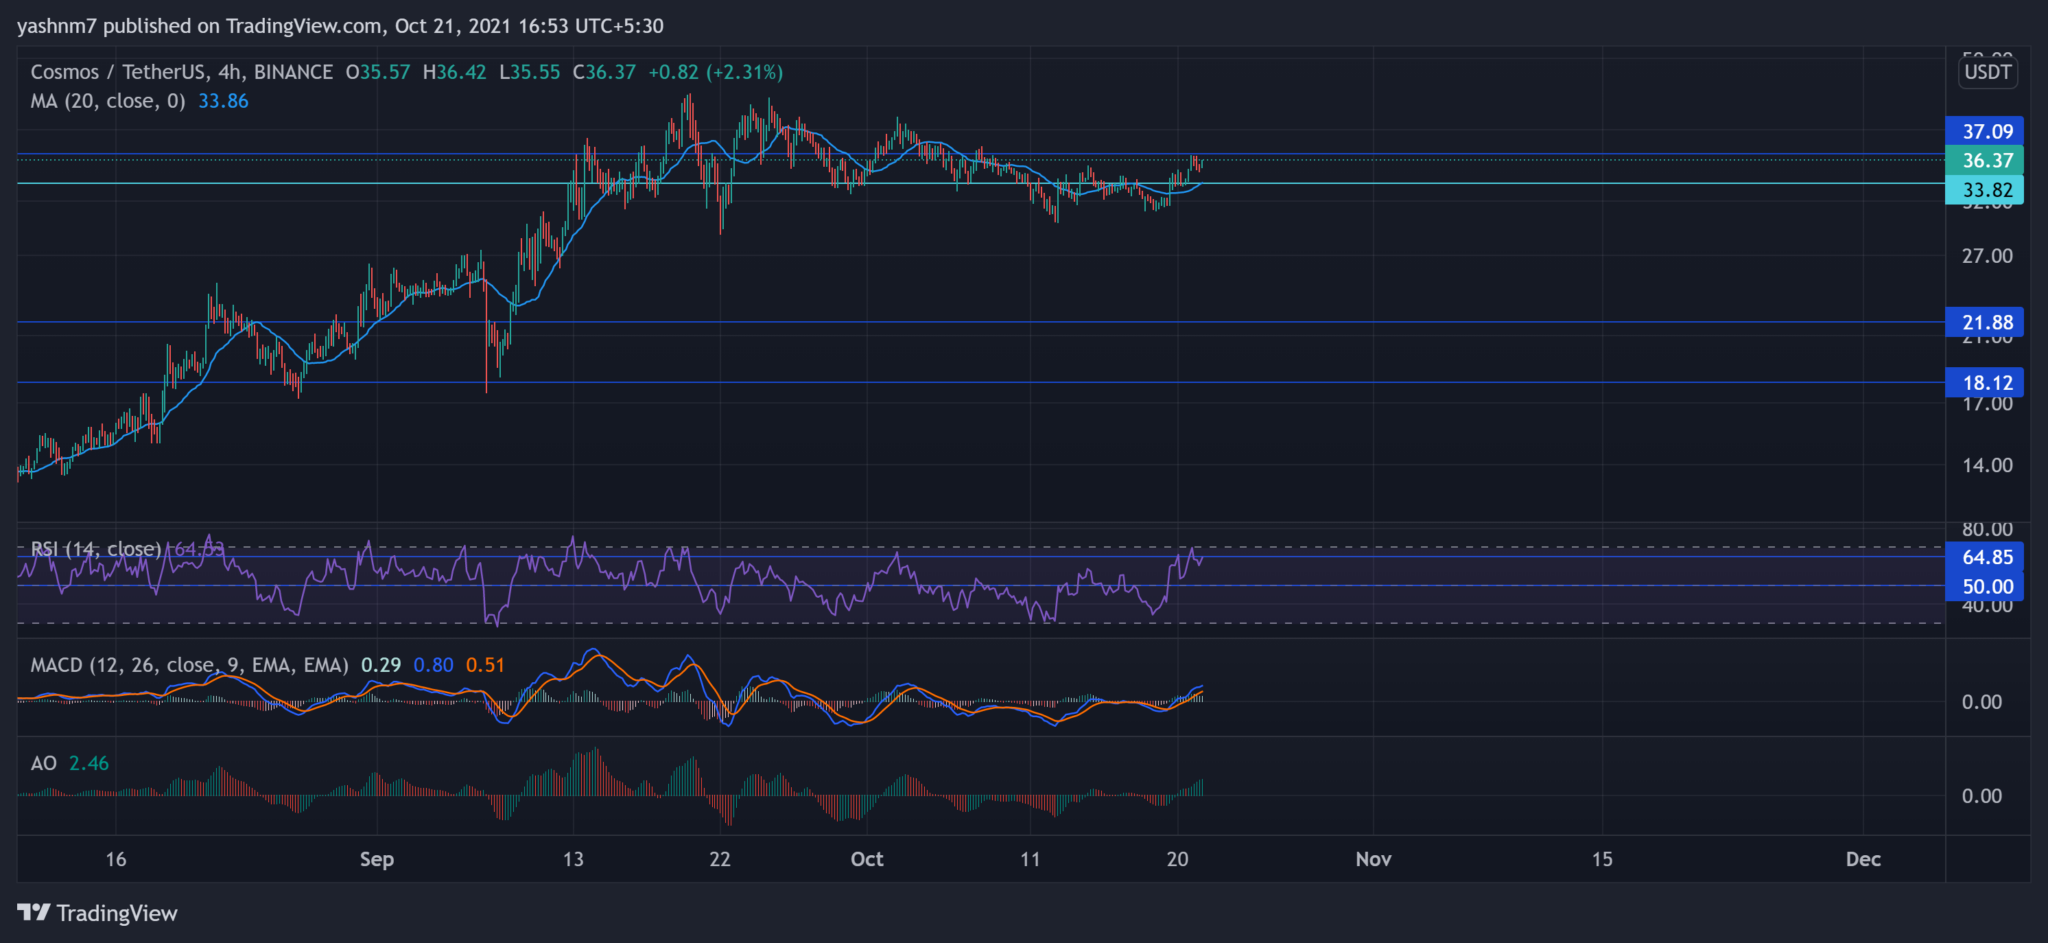
ATOM was trading at $36.37 at the time of analysis, up 6.93 percent. The indicators clearly indicated a tendency for bullish price action. ATOM has been on an upward trend in the last 24 hours, trading near its resistance level of $37.09.
The immediate support price for the altcoin was $21.88. The 20-SMA was at $33.82, well below the trading price, indicating that price momentum was in favor of the buyers.
The RSI recorded higher highs and was above the half-line at 64.85, confirming the bulls' strength. The MACD histogram and the Awesome Oscillator were both above the zero line, indicating a preference for bulls in the short term.
AAVE

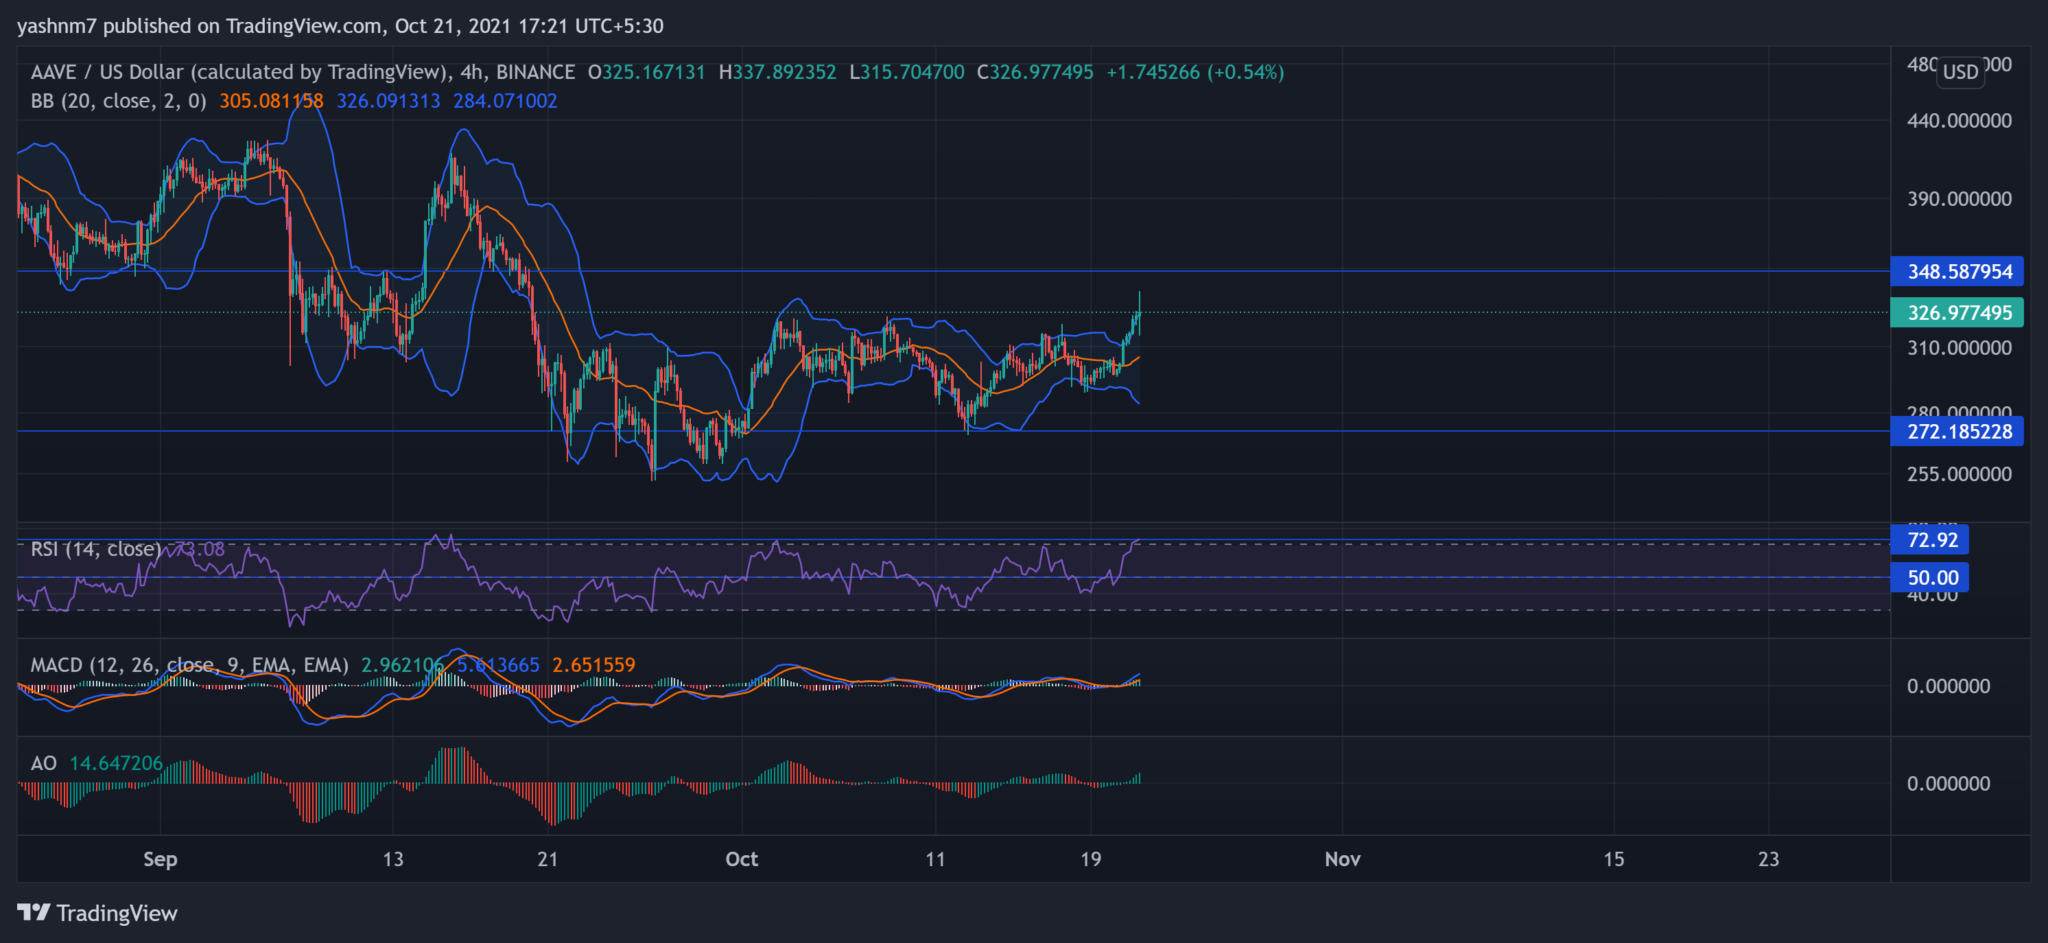
At the time of writing, AAVE had gained 7.95 percent and was trading at $326.98. The cryptocurrency's price ceiling and floor were $348.59 and $272.19, respectively.
The MACD (blue) crossed above the Signal line (orange), indicating bullish tendencies. The MACD histogram and Awesome Oscillator both flashed green signal bars, confirming the bullish bias.
After crossing the 70-point mark, the RSI entered overbought territory, indicating that the bulls had taken control. Also implying that a trend reversal is imminent. The trading price was slightly above the upper band of the Bollinger Bands, indicating that the position was overbought.


