More On: bch
In May, the market capitalization of Bitcoin Cash fell by more than $1.5 billion
Bitcoin Cash, MATIC, and Tron Price Analysis for October 30th
Bitcoin Cash, Cosmos, and Aave Price Analysis for October 21st
Over the last day, there was no significant volatility in the global crypto market cap. Following the correction phase, the bulls appeared to have regained control of the recent momentum.
As a result, Bitcoin Cash and Tron demonstrated a bullish trend.
However, MATIC technicals have continued to point to a possible slowing of bullish momentum in the near term.
Bitcoin Cash (BCH)
Since the beginning of the month, BCH bulls have demonstrated their zeal, as the price has risen by 38% to reach a six-week high on October 21. Following that, the price action experienced a blip as it fell to its 26-day low of $534.2.
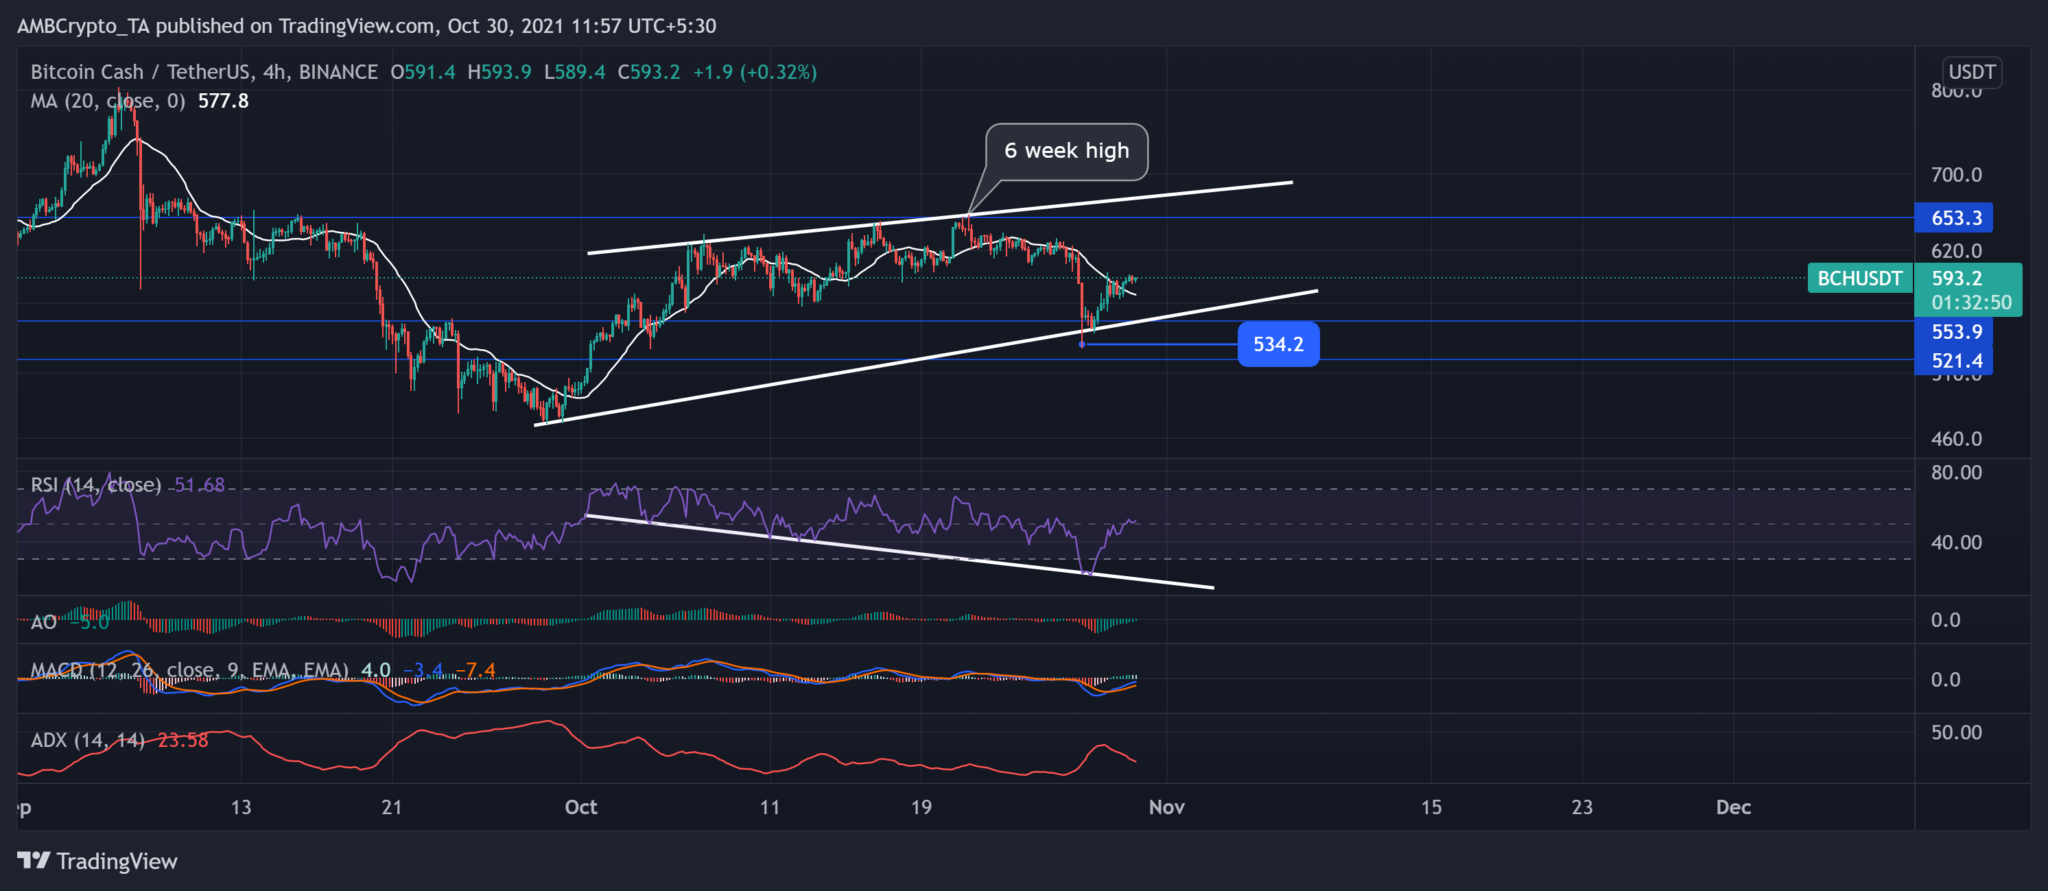
Despite bear pressure, bulls continued to push, as evidenced by the 20-SMA (white). In the short term, BCH bears have found resistance at $653. The altcoin was trading at $593.2, up nearly 1% from the previous day.
The Relative Strength Index (RSI) has risen in the last 24 hours, indicating increased buying power. Furthermore, the lower trendline marked higher lows while the RSI trendline marked lower lows, indicating a clear bullish divergence.
The MACD and Awesome Oscillator (AO) also flashed green signal bars, confirming the previous reading. The ADX, on the other hand, was at 23, indicating a slightly weak directional trend.
Polygon (MATIC)
Since September 26th, MATIC price action has taken a bullish turn as it bounced between two parallel lines pointing north. The monthly and weekly ROI for the digital currency were 73.39 percent and 19.11 percent, respectively.
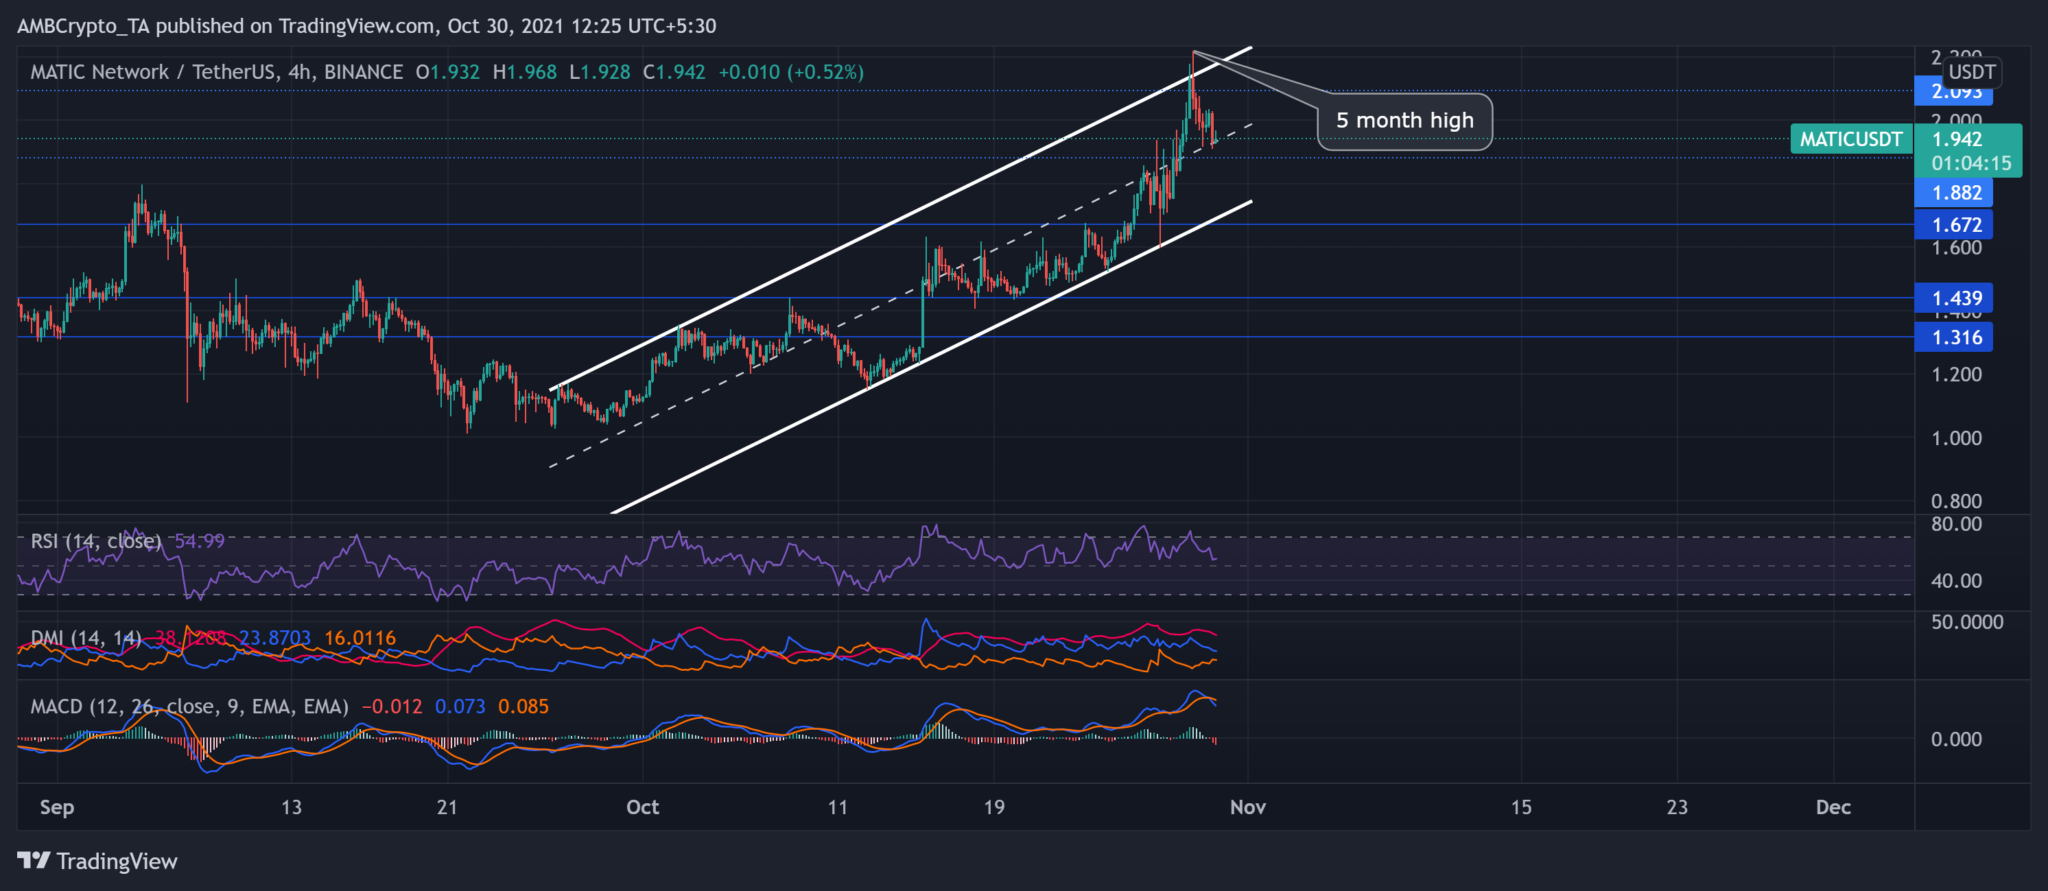
As a result, MATIC hit a five-month high on October 29 and bounced back between the parallel lines, following the trend. However, the altcoin fell 5.15 percent in 24 hours as technicals indicated a drop in buying strength in the near term. MATIC was trading at $1.942 at the time of publication.
The RSI fell by 10 points and is now approaching the midpoint, indicating that buying strength is waning in the near term. Furthermore, the DMI showed buying strength but hinted at a possible slowing in bullish momentum as the DI line moved downward. Furthermore, MACD flashed red signals and appeared to be heading south in the near term.
Tron (TRX)
The altcoin was trading at $0.10348 and had gained 7.78 percent in the last 24 hours on its charts. TRX has been in an uptrend over the last month, as evidenced by the higher highs marked on its trendline. TRX bears, on the other hand, kept up the pressure and found support at $0.08681.
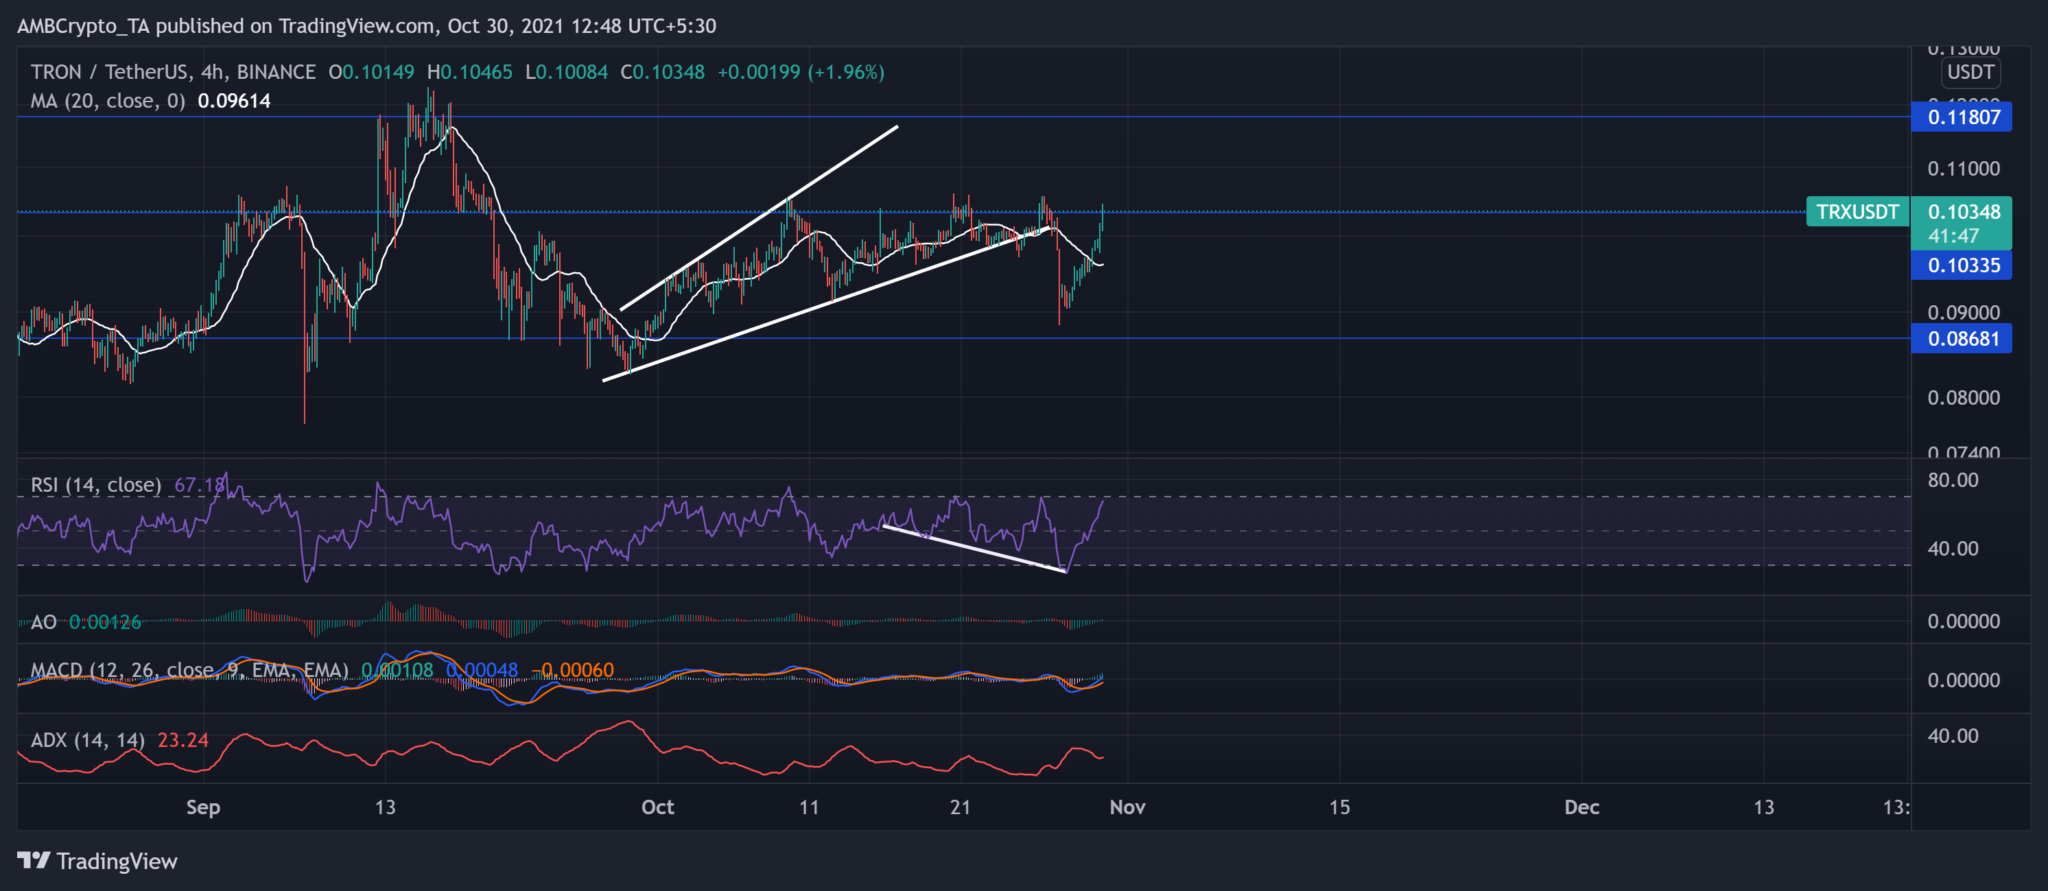
On October 27, the token's price dropped to a one-month low. Bulls demonstrated tremendous power over the last day as the price surged.
After rising by 25 points in a single day, the RSI was approaching overbought territory. In addition, MACD and AO flashed green signals, confirming the previous readings. The ADX line, on the other hand, was at 23, indicating a slightly weak directional trend.


