More On: etc
In July, ETC increased by more than 150 percent as ETH 2.0 approaches
Russia has approved tax breaks for cryptocurrency issuers
Donations in Cryptocurrency Donated to Ukraine in Secret Amount of $20.9 Million
Is it time to reject yet another bearish setup on the chart for Ethereum Classic?
Brian Leetch resigns from job as Rangers adviser
Despite the fact that Ethereum Classic has maintained a positive ROI of 6% so far in October, a slew of altcoins have outperformed the world's 29th largest cryptocurrency.
Disclaimer: The following analysis' findings are the author's sole opinions and should not be construed as investment advice.
On the chart, the price action of ETC has been largely influenced by a double top and a series of flash crashes in September. Despite a slight rebound in the first week of October, an impending descending triangle clouded ETC's near-term outlook. At the time of writing, the cryptocurrency was trading at $52.4, down 0.9 percent in the previous 24 hours.
4-hour Ethereum Classic Chart
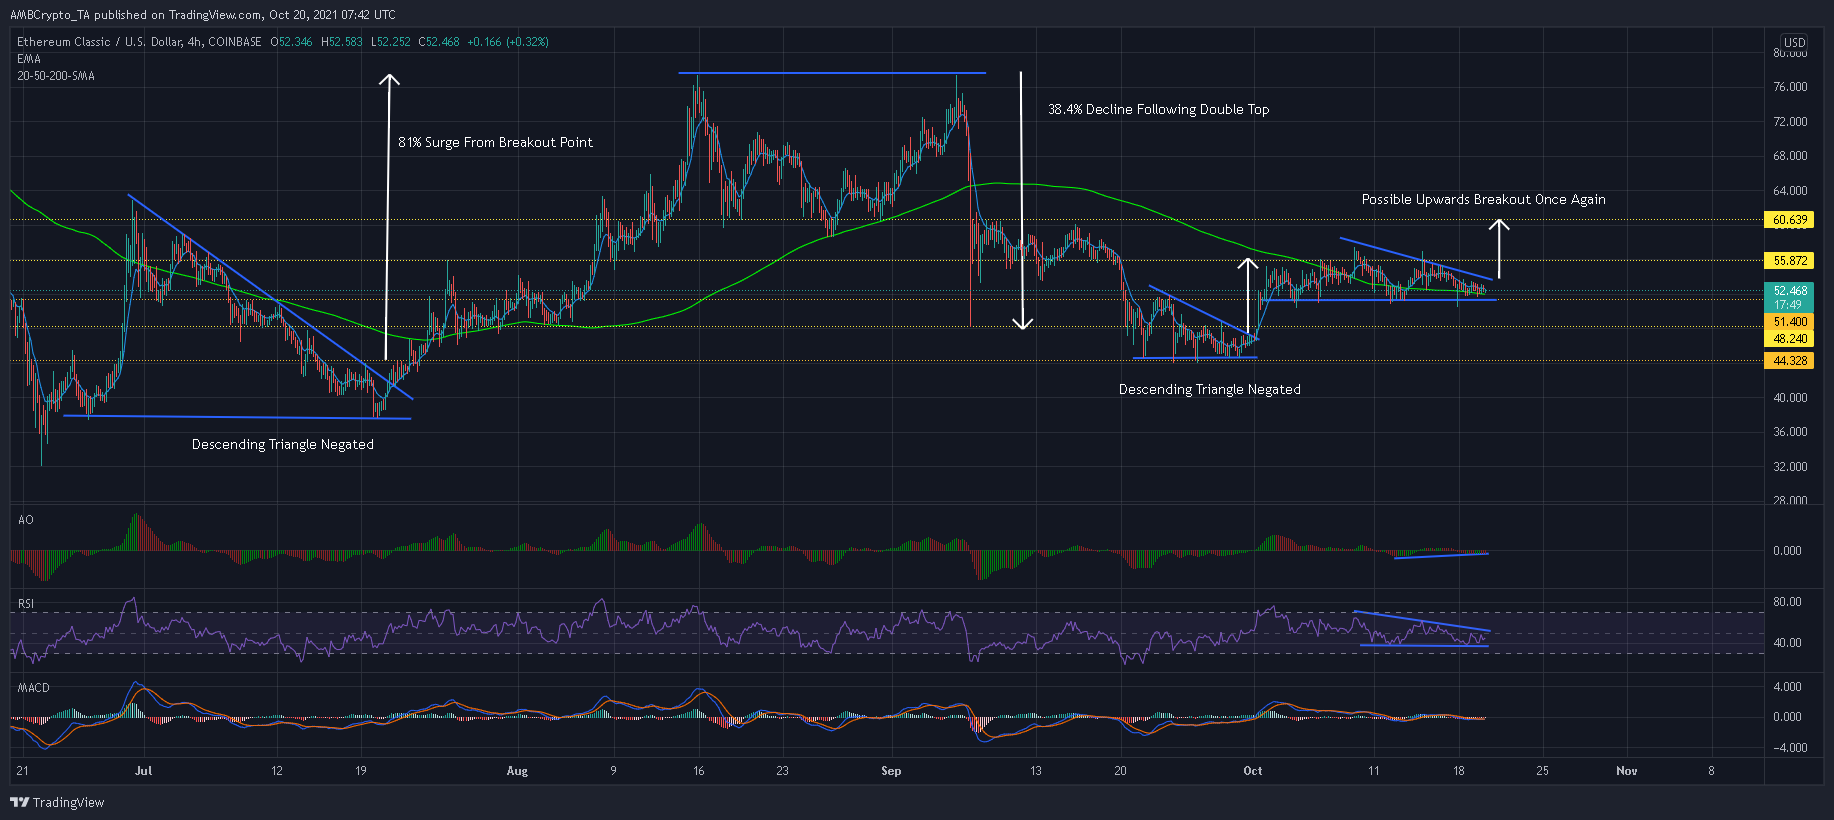
Over the last week, steady lows around $51.4 have been combined with lower highs, indicating a descending triangle setup on ETC's 4-hour timeframe. The 200-SMA (green) was delaying a fifth attack on the bottom trendline at the time of writing, but expect this base to be tested again if bears negotiate past the long-term moving average line.
If bulls are unable to keep sell pressure below $51.4, ETC faces a breakdown from the pattern and a 13.5 percent depreciation in value. Buyers can retaliate at short-term support levels of $48.2 and $44.3.
Interestingly, ETC has rejected the last two descending triangle setups – one in mid-July and the other in late September. In fact, the alt has begun an upward trend on both occasions, as bulls formed their own breakout.
Based on these findings, ETC would look for a northbound move from the pattern if a similar development occurred. According to the setup's highs and lows, ETC aimed for an 11 percent gain from the breakout point. Furthermore, a close above $60.6 on strong volume would allow bulls to hunt for additional price levels more aggressively.

Reasoning
Market participants should keep an eye on ETC's RSI for more clarity on a breakout. The RSI, which is also trading within a descending triangle, would support a bearish outcome if it fell below the 35-support level.
Bulls, on the other hand, would like to keep the RSI within the pattern and aim for a peak above 50-55. Meanwhile, the MACD remained bearish-neutral, while the Awesome Oscillator showed a slight bullish divergence.
Conclusion
The outcome of ETC was almost evenly split between bullish and bearish. If bears can force a close below $51.4 or the RSI falls below 35, ETC will suffer a 13.5 percent loss.
Bulls, on the other hand, will look to defend against another attack at the baseline, which could force a move in their favor.


