More On: eth
Who is worse for your wealth, politicians or billionaires?
Why Jim Cramer suggests purchasing bitcoin or ethereum, with one exception
Official death certificate revealed Queen Elizabeth II’s cause of death
After losing, the women's basketball team from Mali gets into a fight
Meghan Markle didn't know how to act around the Crown Jewels
- As the token continues to consolidate, the price of Ethereum may fall to find critical levels of support.
- An increase in bullish sentiment could send ETH higher, with the next target being $3,272.
- At $2,851, Ethereum may face the most difficult challenge.
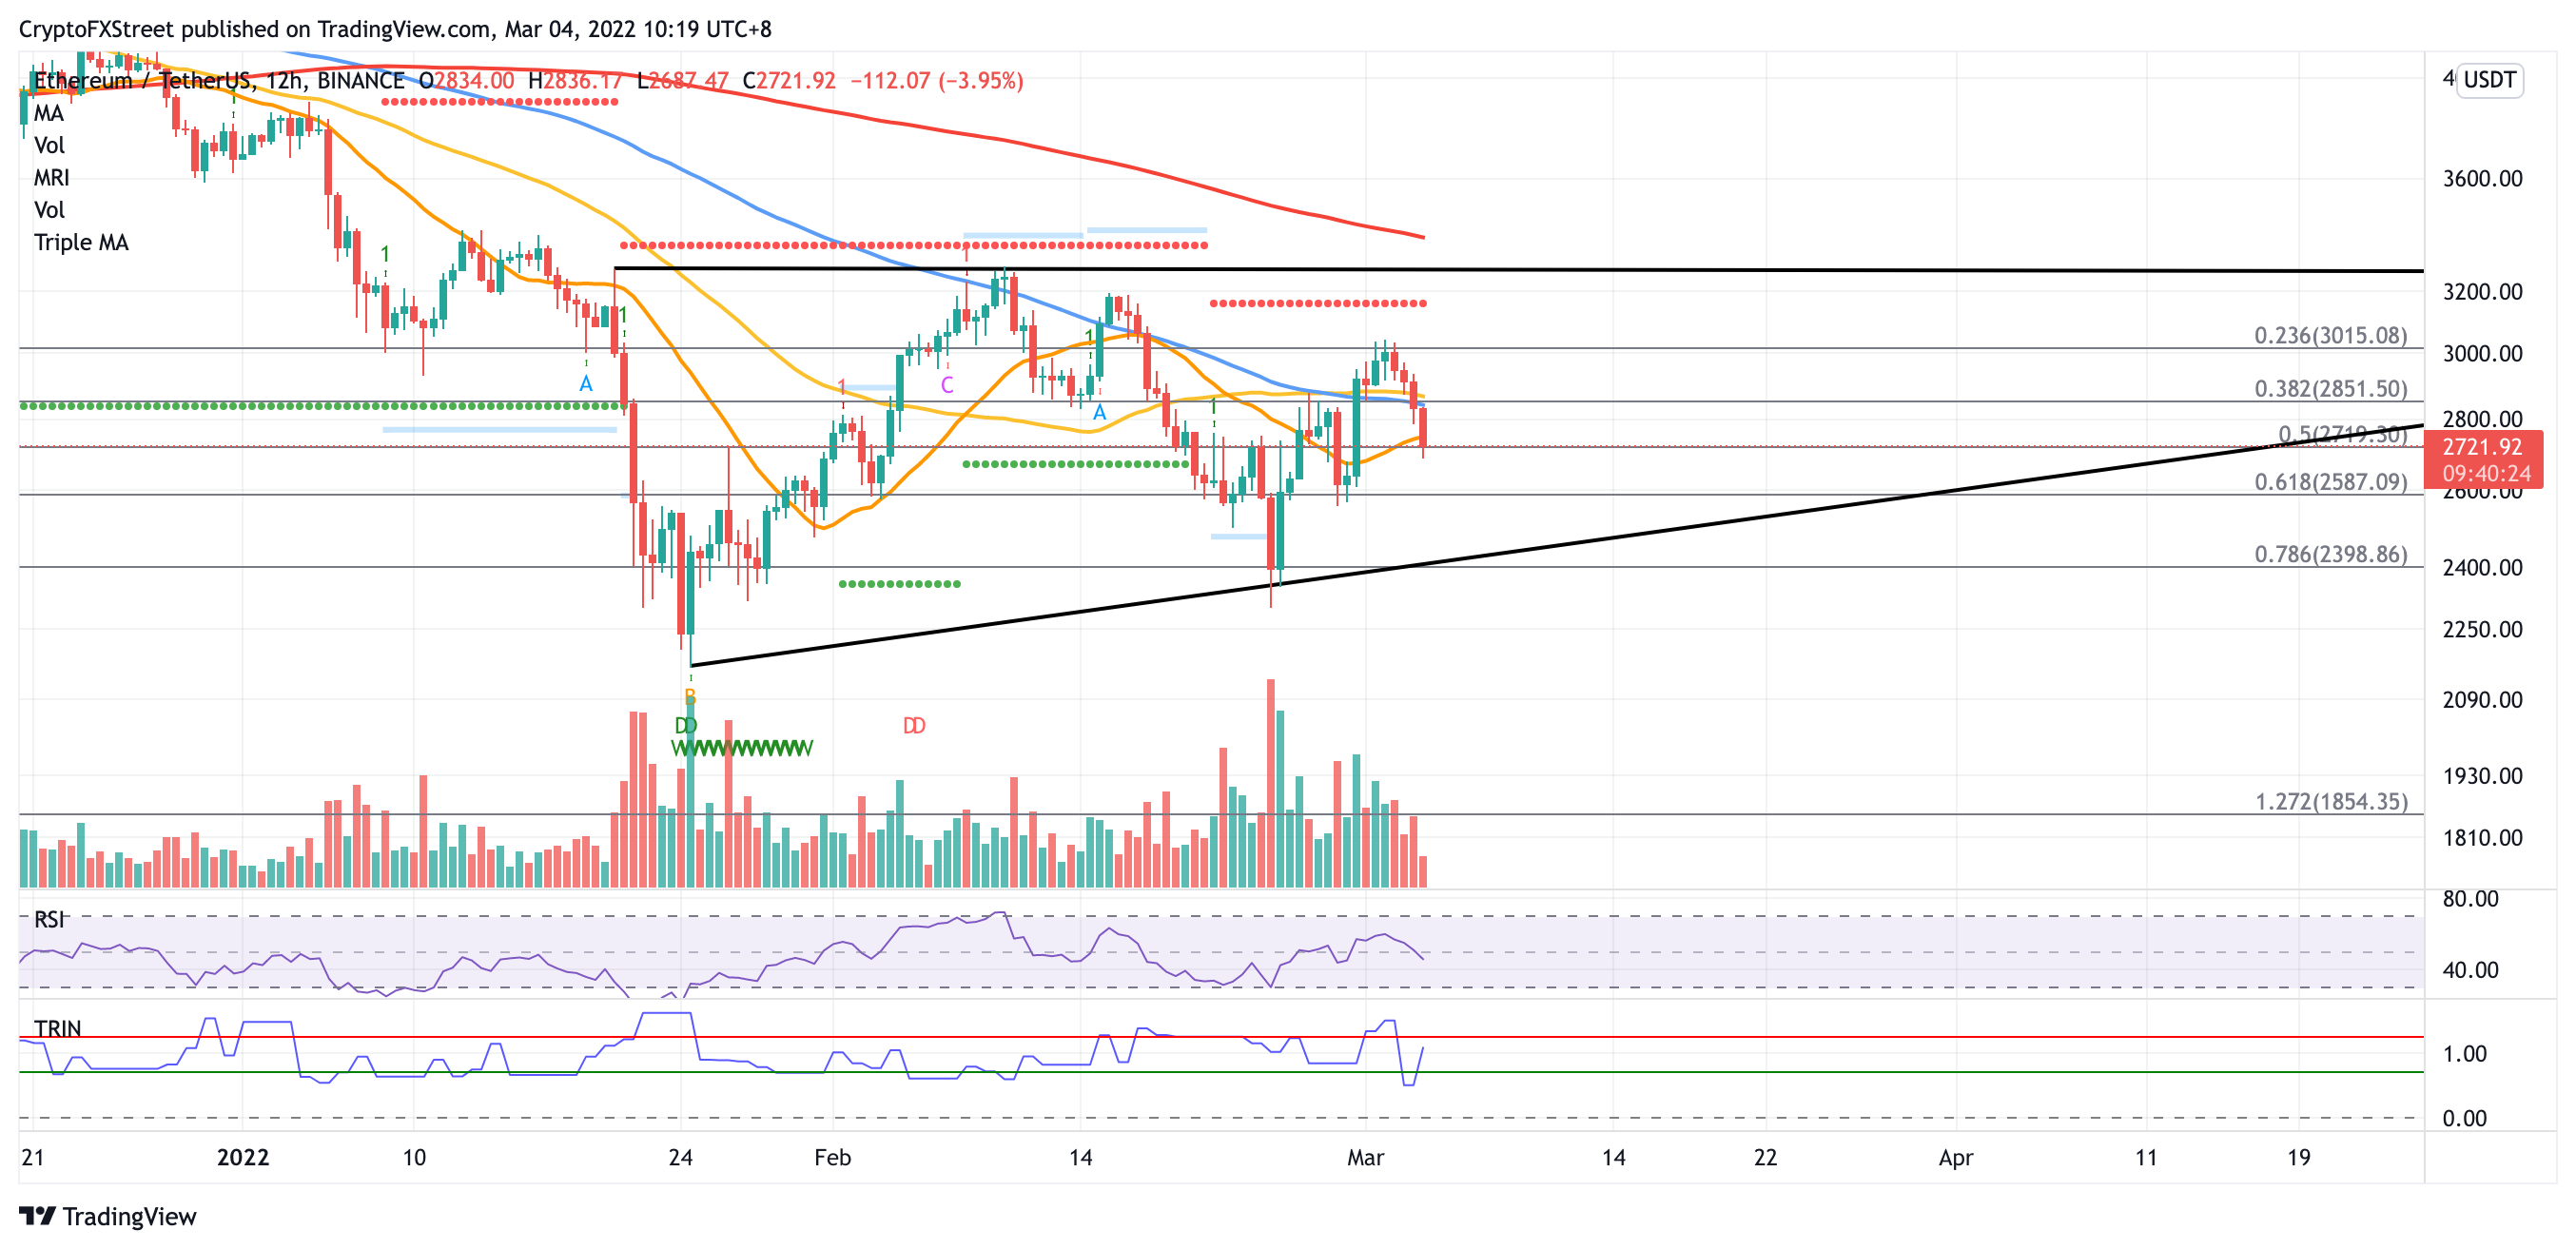
Before moving higher, the price of Ethereum may continue to fall in order to find critical levels of support. ETH will have to overcome a number of difficult obstacles before it can attempt to break through the upper boundary of the governing technical pattern at $3,272.
The price of Ethereum is testing critical levels of support.
On the 12-hour chart, Ethereum price has formed an ascending triangle pattern, indicating a long-term bullish outlook. However, momentum has shifted to the downside, and ETH may fall below multiple levels of support.
The 50 percent retracement level at $2,719 is the first line of defense, followed by the 61.8 percent Fibonacci retracement level at $2,587.
At $2,398, the lower boundary of the prevailing chart pattern will intersect with the 78.6 percent Fibonacci retracement level, an additional foothold will emerge.
Further selling pressure may incentivize sellers to cut below the downside trend line of the governing technical pattern, invalidating the long-term optimistic outlook.

If buying pressure increases, Ethereum price may encounter immediate resistance at the 21 twelve-hour Simple Moving Average (SMA) at $2,747.
The 50-day simple moving average, the 100-day simple moving average, and the 38.2 percent Fibonacci retracement level will all intersect at $2,851 next.
If there is a surge in buy orders, Ethereum may rise to the 23.6 percent Fibonacci retracement level of $3,015. An increase in bullish sentiment may push ETH higher toward the Momentum Reversal Indicator (MRI) resistance line at $3,156 before the token reaches the upper boundary of the prevailing chart pattern at $3,272.
Slicing above the governing technical pattern's topside trend line will put the Ethereum price on track for another 33 percent rise toward $4,372.
** Information on these pages contains forward-looking statements that involve risks and uncertainties. Markets and instruments profiled on this page are for informational purposes only and should not in any way come across as a recommendation to buy or sell in these assets. You should do your own thorough research before making any investment decisions. All risks, losses and costs associated with investing, including total loss of principal, are your responsibility. The views and opinions expressed in this article are those of the authors and do not necessarily reflect the official policy or position of USA GAG nor its advertisers. The author will not be held responsible for information that is found at the end of links posted on this page.


