Now that the presidential campaign season is in the rear-view mirror, it’s clearly time to get back to normal. Unfortunately, normality isn’t any more linked to the truth than is the election cycle, even if the lies are a lot harder to spot. But as is always the case in politics, all you need to do is follow the money, or the promise thereof.
And when politicians talk about money, they are almost always talking about figures and forecasts made by the Congressional Budget Office, a nonpartisan organization charged with providing budgetary analyses to Congress.
Periodically, the CBO produces ten year forecasts of federal spending, revenues, and debt. These projections, called “baseline projections,” are the CBO’s best guess as to what spending, revenue, and debt will look like in the future, assuming no change in governmental policies. While it is unrealistic to assume that policies will remain fixed, the baseline projections provide a means of comparing proposed changes in specific policies by holding everything else constant.
While the CBO’s baseline projections aren’t meant to be used as forecasts of the future, with some adjustments, they are consistent enough to provide some insights into the future. The CBO’s latest budget outlook has the federal government running budget deficits of over $1 trillion per year for each of the next ten years. That would leave us with a gross federal debt just shy of $38 trillion by 2030.
But how accurate are these projections?
A comparison of past CBO baseline projections to what actually transpired reveals a pattern, and to anyone who keeps an eye on the government it is not a surprising pattern. The CBO’s baseline projections under-estimate future federal spending, and over-estimate future federal revenues.
Quelle surprise.
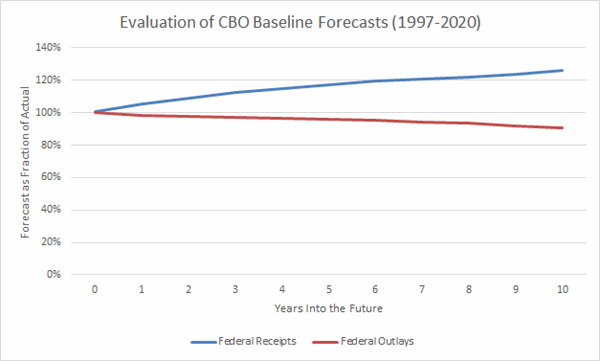
From 1997 to the present, the CBO has made 198 revenue projections that we can compare to what actually happened. When projecting one year into the future, CBO’s revenue projections are too high by an average of five percent. When projecting five years into the future, their revenue projections are too high by an average of 17 percent, and when projecting ten years into the future, their projections are too high by an average of 26 percent.
These rosy projections aren’t due to a handful of projections being markedly off on the high side. The CBO consistently over-estimates revenues. Of the 198 revenue projections it has made, more than 80 percent were too high. If the CBO’s projections were unbiased, we’d expect about half to be too high and half to be too low. That 80 percent are too high indicates a flaw in the projections themselves.
Granted, these are baseline projections that assume no future policy changes. However, when policy changes make revenue projections too rosy 80 percent of the time, to assume no policy changes is to assume a significant change in policy.
While the CBO’s revenue projections are consistently too high, their spending projections are, predictably, consistently too low. Of the 198 spending projections that have come to pass, 60 percent were too low. When forecasting one year out, CBO under-predicts spending by around one percent. When forecasting five years out, CBO under-predicts spending by four percent, and when projecting 10 years out, almost 10 percent.

Consistently over-predicting receipts while under-predicting expenditures results in all manner of trouble, especially when the numbers in question are produced at the behest of Congress, which has never been particularly budget conscious. And the differences between the CBO’s predictions and reality are a lot more problematic than they first appear to be, manifesting in ever more federal debt with each predictive misfire.
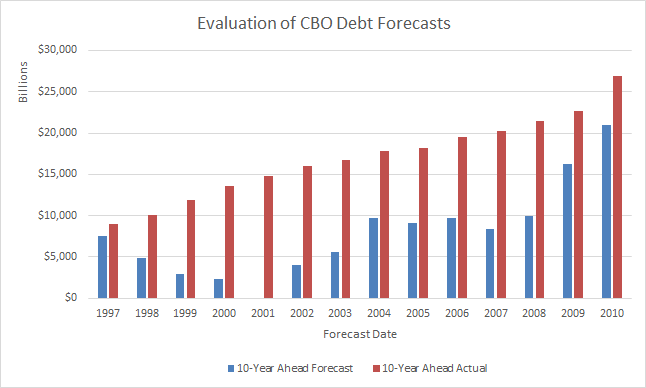
Of the CBO’s 198 projections since 1997, almost 80 percent have under-predicted future debt. And the size of the error is quite large. When forecasting five years into the future, the CBO’s projection for the debt is, on average, about 25 percent too low. When forecasting ten years into the future, the CBO’s projection tends to be around 55 percent too low. In other words, the actual federal debt ten years into the future tends to be more than double what CBO projects.

As of September 2020, the CBO projects that the federal debt will be almost $38 trillion by 2030. If this forecast is off by the same amount as the CBO’s average ten-year forecast, we can expect the debt by 2030 to be north of $50 trillion. While that may sound unbelievable, consider that in 2010 the CBO projected the federal debt would be less than $21 trillion by 2020. Today, at over $27 trillion, the debt is around 30 percent larger than predicted. Of course, around three trillion of that was due to the COVID lockdown. But absent COVID, the CBO’s projection for 2020 would have still been around 12 percent too low.
But does it even matter if the CBO’s debt projections are off? The federal government has been borrowing increasing amounts of money for decades without consequence. That the CBO has underestimated the magnitude of the borrowing doesn’t change the fact that the borrowing—enormous though it is—hasn’t caused any real problems. At least so far.
But we cannot run the debt up forever without severe repercussions.
There is a point at which the federal debt will have to be monetized, largely because lenders eventually lose their taste for lending. All the money the federal government borrows comes from four sources: foreign lenders, private domestic lenders, the Federal Reserve, and intragovernmental debt (mostly, money borrowed from the Social Security trust fund and government employee pension funds). Over the past decade and as a fraction of total federal debt, money borrowed from intragovernmental sources has declined more than 40 percent, money borrowed from foreign sources has declined 15 percent, money borrowed from private domestic sources has risen 35 percent, and money borrowed from the Federal Reserve has increased more than 200 percent.
The Social Security trust fund has run out of money to loan the government. Foreign investors are lending the US government more than they did a decade ago, but the growth in their lending has been slower than the growth in federal borrowing. When it comes to lending ever more money to the federal government, the Federal Reserve and private domestic lenders are doing the heavy lifting. Not coincidentally, over the past decade, the velocity of money has declined more than 50 percent. This indicates that new money the Federal Reserve has pumped into the economy has been going largely into savings—and one of the places private domestic savers park their savings is in Treasury bills. The evidence points to the fact that the Federal Reserve is financing a growing share of the federal debt by printing money. As the federal debt continues to grow, the Federal Reserve will come to play an ever greater role as the lender of last resort.
So we already have monetization. How long can it go on?
We have one example in our history. In the late 1700s, the federal government assumed the war debt that the former Colonies had incurred in the Revolution. Upon taking on the debt, the government then issued a new currency—the US dollar. Citizens who held the old Continental dollars could exchange them for the new US dollar for around one percent of their face value. The new dollar served a dual purpose: It unified the control of the young country’s currency under the federal government, and it removed from circulation the Continental dollars whose values had been massively eroded as the states printed money to fund the war effort.
At the time, the government’s debt totaled 15 times annual federal revenues. For perspective, federal debt reached a high of around 6 times annual federal revenues during the Civil War and again World War II. Today, at $27 trillion, the federal debt is almost 8 times annual federal revenues—higher than it was during our greatest wars, yet still just over half of what it was in the late 1700s. And, if CBO forecasts are to be believed, the debt-to-revenue ratio will rise to 8.5 in 2021, then fall steadily to just below 7 by 2030.
If CBO forecasts are to be believed.
If we adjust CBO forecasts for their historical biases, we get a very different picture. The adjusted CBO numbers show the debt-to-revenue ratio passing the 15 mark sometime in 2028. If the CBO’s current forecasts are as off as have been their historical forecasts, sometime in 2028 the federal debt will reach a level that, when last seen, caused the government to issue a new currency.
So following the money turns out to be an unhappy affair. Our politicians, aided and abetted by the Congressional Budget Office, have managed to maintain a business-as-usual economy even as they have started monetizing the massive US debt. There is only more of this in the future, and when more of this comes it will just be a matter time before crippling inflation comes too.
@AntonyDavies is Associate Professor of economics at Duquesne University, and the Milton Friedman Distinguished Fellow at the Foundation for Economic Education.
@JamesRHarrigan is Managing Director of the Center for the Philosophy of Freedom at the University of Arizona, and the F.A. Hayek Distinguished Fellow at the Foundation for Economic Education.
Together, they host the weekly podcast Words & Numbers.


